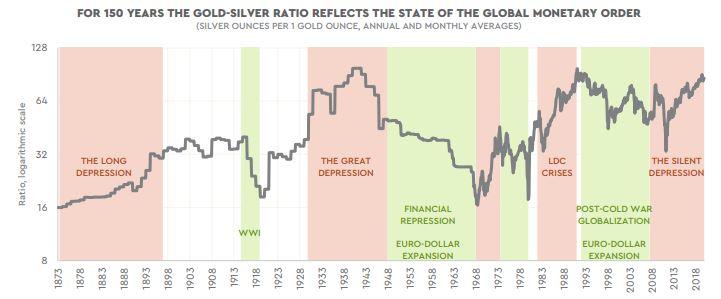
The Gold-Silver Ratio
Authored by ‘mickeyman’ via The World Complex blog,
A couple of weeks ago, Wheaton Precious Metals released a very useful study on the gold-silver ratio.
Today I would like to take a look at some of its implications.
The most important implication is one that everyone needs a little time to absorb. That is that there is no characteristic value for the gold-silver ratio (GSR).
That means that there is no “true north”, or no mythic value (16, for instance) to which it is attracted, and to which it would return if only the world stopped manipulating its price.
The Wheaton conclusions are quite definite.
-
The gold-silver rises during deflationary periods and disinflationary periods (we’ll look at this distinction shortly).
-
The gold-silver ratio falls during inflationary periods.
What is unclear is whether a rising GSR causes deflation, or deflation causes a rising GSR. I know which one I believe.
Let’s test this against some measures I’ve used for deflation/inflation. I’ll use the weekly chart of USDX vs gold price, weekly, going back to the beginning of 2008.
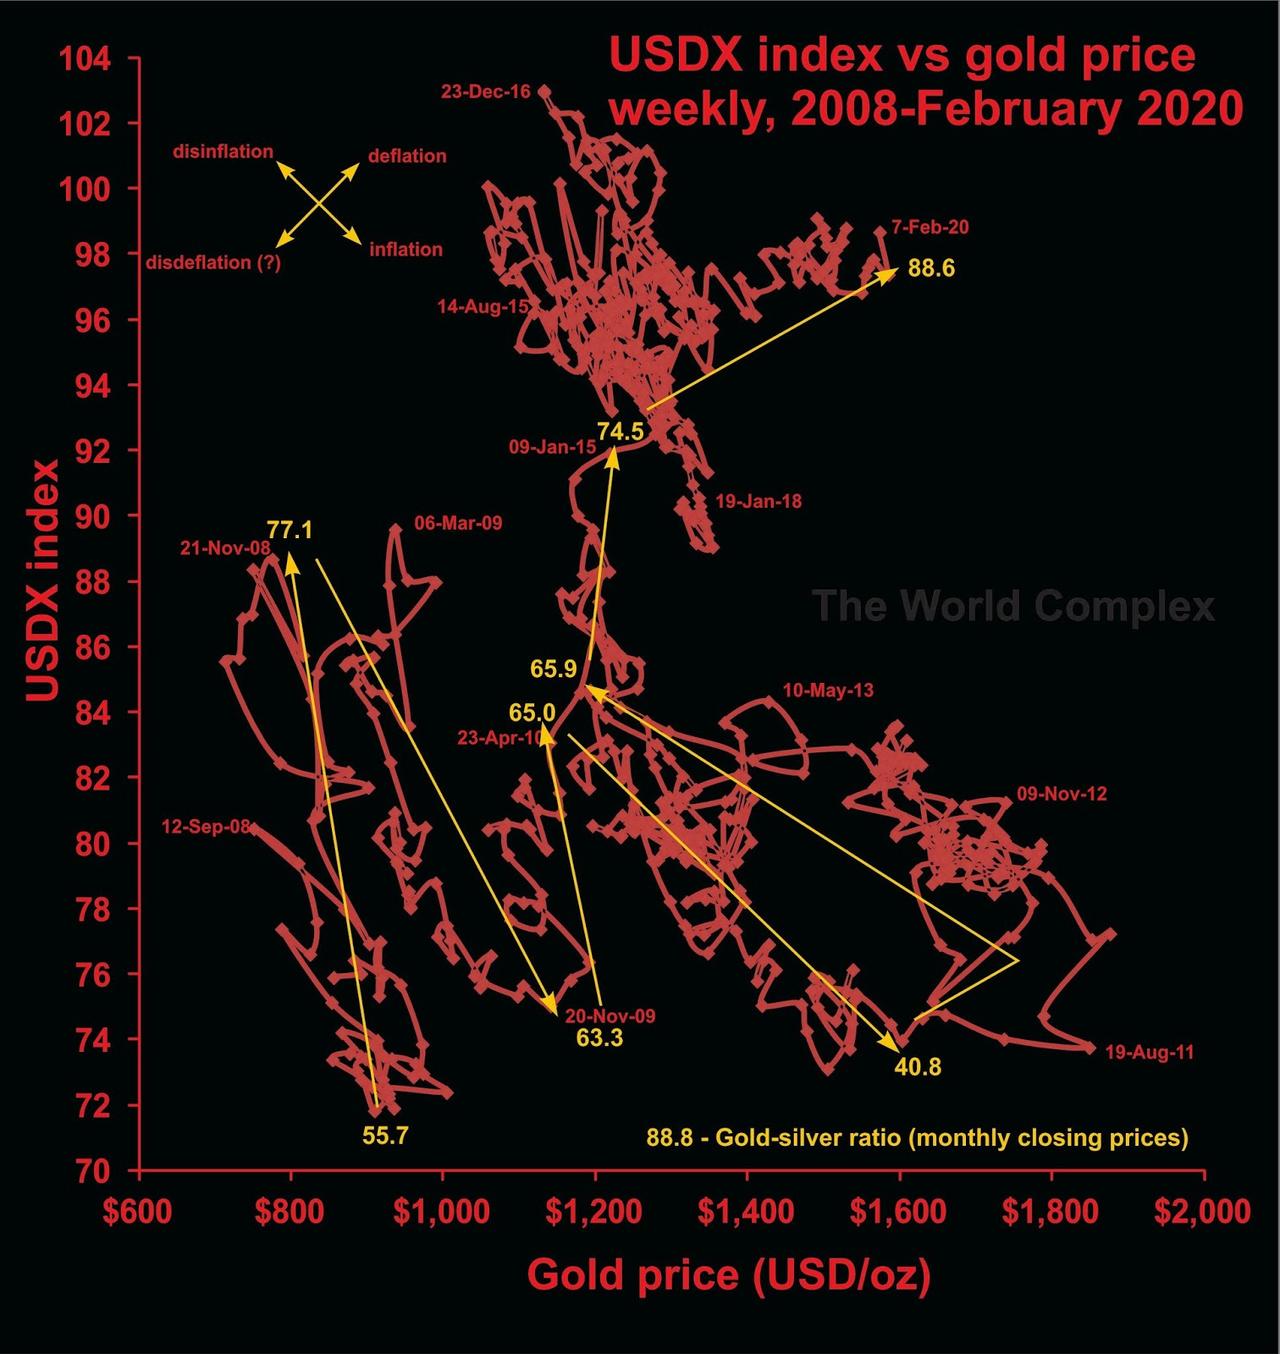
It is a busy visual, but what we want to do is look at longer-scale variations.
-
Intervals when both the USDX index and the gold price rise are considered deflationary.
-
If gold rises and the US dollar index falls, we have inflation (hence inflation and deflation are not opposites).
-
Gold falling and the dollar rising will be disinflation, and I suppose that
-
if both gold and the US dollar fall, we must have disdeflation, although I have never seen that word anywhere. It’s a little hard to say, so it might be best to leave it nameless, and remember that if it ever happens, you should be shorting gold stocks.
Through most of 2008, the graph above suggests we were experiencing disinflation, and over that interval, GSR rises from 55.7 to 77.1
Much of 2009 was characterized by inflation, and the GSR fell from 77.1 to 63.3.
Until the middle of 2010, we had disinflation, and the GSR rose slightly.
The big inflationary pulse into late 2011 saw the GSR falling to 40.8. The final blow-off in the gold price did not see any movement in the US dollar index, so it technically lies between inflation and deflation, but I don’t know what to call it. The GSR actually rose during that interval, which makes some sense as the gold price rose over $200 in that time.
The following disinflationary episode that lasted through 2013 saw the GSR rise to 65.9.
Since then, the dominant trend has been deflationary, although realistically there have only been two deflationary pulses–through early 2015 (GSR 74.5) and over the past 18 months (GSR at 88.6). Most of the time has been consumed by short inflation-disinflation cycles, with slight rises and falls of the GSR without significant trend.
Over the entire chart (twelve years) the big picture is deflation, but most of that has been accommodated through cycles of inflation and disinflation.
So long as deflationary conditions persist, the GSR may rise without limit. As long as debts are created beyond any ability to repay them, deflationary conditions will rule. Under such conditions, despite the GSR being pretty much the highest in history, gold remains a better investment than silver.
However, as much of the actual deflationary effect is brought about by cycles of inflation and disinflation, there are brief intervals where silver makes a better investment than gold. But rather than using the level of the GSR as your selection criterion, you need to look closely at monetary policy instead.
Tyler Durden
Sat, 02/15/2020 – 17:30![]()
Zero Hedge’s mission is to widen the scope of financial, economic and political information available to the professional investing public, to skeptically examine and, where necessary, attack the flaccid institution that financial journalism has become, to liberate oppressed knowledge, to provide analysis uninhibited by political constraint and to facilitate information’s unending quest for freedom. Visit https://www.zerohedge.com