JPMorgan Spots Another Market Paradox: If Everyone Is ‘All-In’, Why Is The Market “Trading Short”?
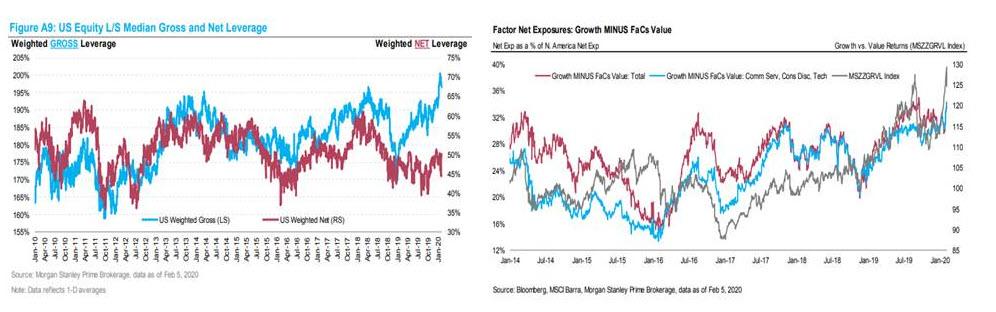
Earlier today we noted that when commenting on the latest positioning in hedge fund land, the Morgan Stanley prime brokerage/quant strategy team calculated gross leverage for long/short hedge funds is near historical highs (much more in the full note), which confirms our previous observations that virtually all investor classes, from retail, to institutional, to hedge funds, to systematics (CTAs, Risk Parity, vol targeting), are all “all in” stocks to never before seen levels.
Picking up where MS quants’ left off, JPMorgan’s own quant guru, Nikolas Panigirtzoglou, focuses on the “rather tight” relationship between the performance of hedge funds and global equities for most of the past three months, which confirms the hedge funds’ “overall elevated exposure to equities”, i.e., excess leverage, which helped them them benefit from the rebound in global equities over the past two weeks. And as the chart below shows, this tight relationship continued in February with little signs of abating.
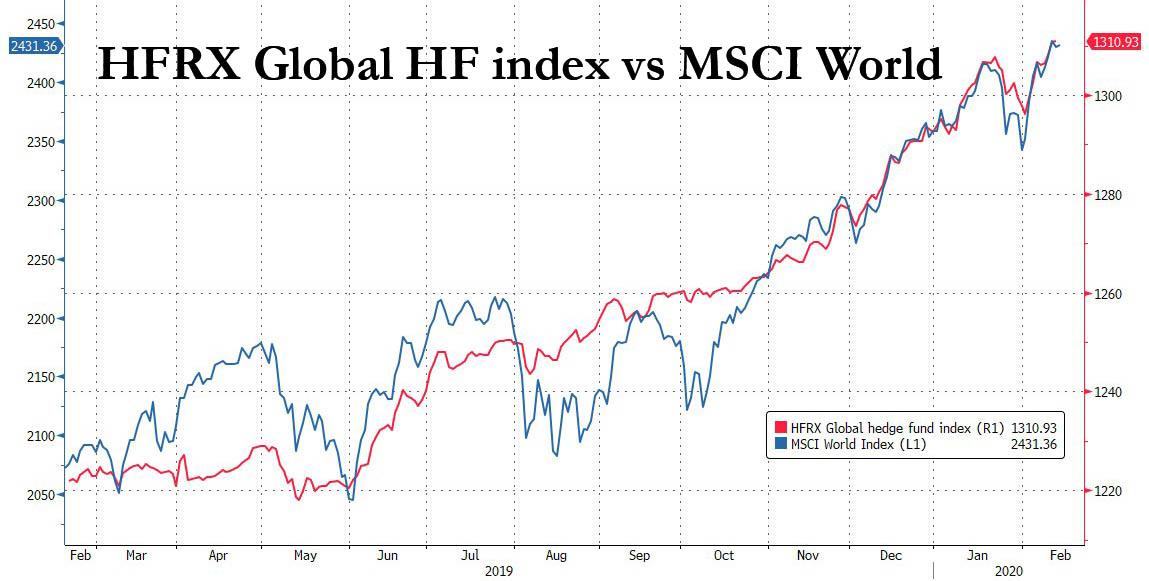
According to JPM, this extreme sensitivity of hedge funds to global equities suggests that little de-risking happened in response to coronavirus, and hedge fund exposure to equities remains near record high.
This leads us to yet another perplexing market observation: If, as the case clearly is that equity investors’ exposures are high, why is the equity market not trading long then? This is a common question JPMorgan gets from our clients. The perception among most clients is that, despite negative news, which have been dominated by coronavirus, the equity market has been trading especially strong, casting doubt to the idea that equity investors’ positioning is elevated.
Before JPM’s Panigirtzoglou answers this question, he notes that the idea that recent newsflow has been mostly negative seems rather overstretched. In fact, economic releases have been overall better than expected, with the bank’s Economic Activity Surprise Index rising sharply YTD to the highest level since January 2018. This index, shown in Figure 2, captures the balance between positive and negative economic surprises globally over a 6-week rolling window.
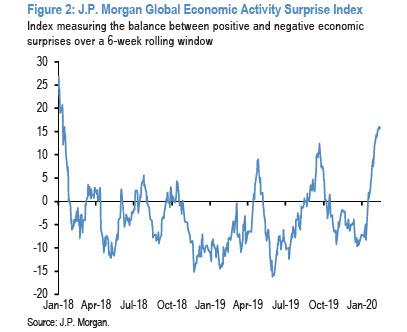
And, as the JPM quant claims, “given how strong the impulse from economic surprises has been so far this year, the fact that equity prices are up rather than down YTD should not be seen as unusual or surprising.”
That said, looking at stock market performance in comparison to the Economic Activity Surprise Index of Figure 2 is a simplistic way of gauging the response of equity prices to economic news. Instead, that response should be more properly assessed on a daily basis based on the sign and magnitude of economic surprises in each day. Indeed, JPM’s alternative position indicator based on the response of equity prices to economic news is doing exactly this. This indicator is shown in Figure 3: it is based on examining equity market reactions to news, where can be thought of “news” as surprises relative to expectations. What is notable here, is that when the MSCI AC World index is more responsive to positive economic news and less responsive to negative news, this would point to an overhang of short equity positions and vice versa.
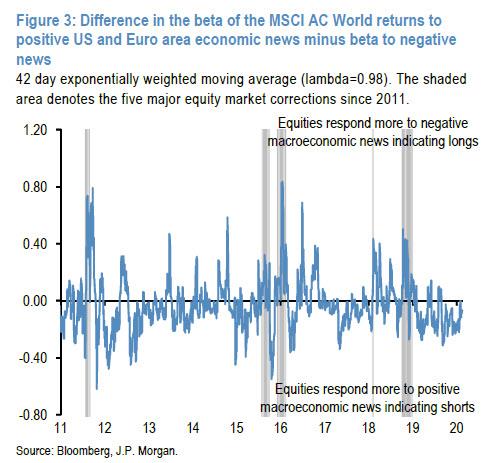
Figure 3 shows that JPM’s alternative position indicator based on the response of equity prices to economic news has been mostly negative this year. This suggests that, in line with JPMorgan client perceptions, the equity market has been indeed trading short, as the MSCI AC World Index has been responding by more to positive vs. negative economic news.
Does this mean that overall market positioning in equities is low at the moment? In contrast to what Figure 1 implies and in contrast to our recent observations that most clients are in fact, all in?
The answer is “probably not”, and in his explanation why that is not the case, Panigirtzoglou writes that a visual inspection of Figure 3 suggests that the vulnerability of equity markets tends to show up belatedly in this indicator, which tends to spike (thus pointing to elevated positioning) only after a correction arises. Indeed, the blue line in Figure 3 spiked during all of the five major equity market corrections since 2011, which are denoted by the shaded areas in the chart. But ahead of each one of these five major corrections JPM’s indicator was negative or low, giving the impression that equity market positioning was low. Once the correction started arising, the indicator spiked rapidly towards very positive territory, implying that equity investors started finding themselves quickly much longer equities than desired.
In other words, this alternative equity market positioning indicator has been rather retrospective and as such only useful in gauging the vulnerability of the equity market during rather than ahead of equity market corrections. Therefore, the fact that this indicator has been mostly negative this year does not necessarily mean that equity investors have low equity positions, or that the equity market is not vulnerable to a correction. It simply says that in a rising market, equity investors typically find themselves shorter equities than desired, but once a correction arises, investors quickly find themselves much longer equities than desired, exposing the vulnerability of the equity market.
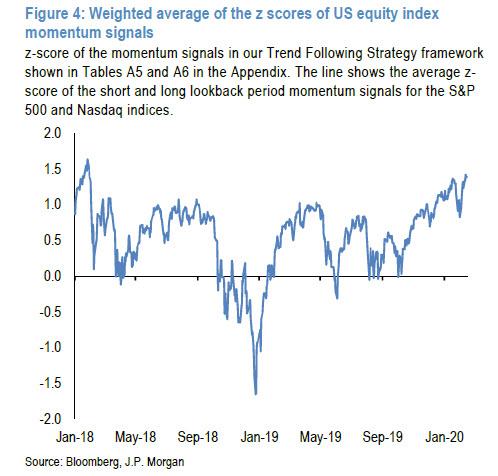
JPM thus believes that “the equity market is currently more vulnerable than the indicator of Figure 3 suggests and this vulnerability stems mostly from two types of investors: CTAs and other trend-following investors, and Equity Long/Short hedge funds.”
Figure 4, for example, shows that the average z-score of the short and long lookback period momentum signals for the S&P 500 and Nasdaq indices has risen to its highest level since January 2018. So momentum traders are likely very long US equities at the moment, almost as long as they were in January 2018.
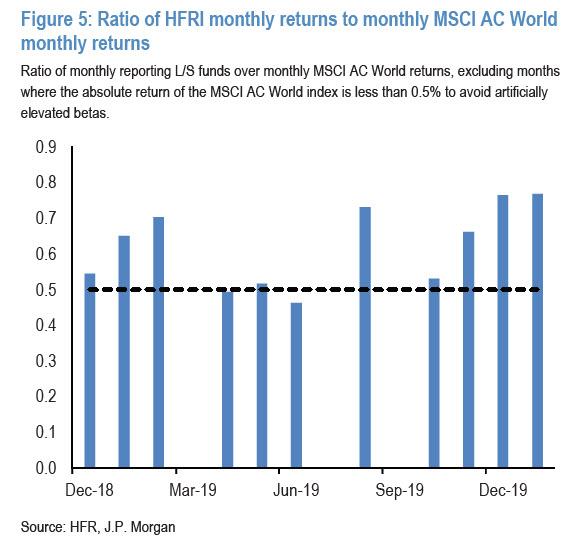
What about the Equity Long/Short hedge fund universe, the biggest equity hedge fund sector? Here JPM find that their beta had increased sharply during last November and December and stayed high in January. Looking for example at monthly reporting Equity Long/Short hedge funds, their beta to the MSCI AC World index stood at 0.53 in October 2019, i.e. just above the historical average of 0.5, but rose sharply to 0.66 in November, 0.76 in December and 0.77 in January, pointing to a significant overweight position. The January beta of 0.77 is not far from their peak equity beta of 0.81 previously seen in December 2017.
Another notable divergence emerges when looking at bonds.
Figure 6 shows the equivalent indicator for bonds, which tries to gauge broader bond market positioning by examining the response of bond markets to news, where “news” can be thought of as surprises relative to expectations. In an idealized world, an environment where bond investors are short duration should see bond markets respond by more to negative news than to positive news. By contrast, in an environment where investors are long duration, the opposite should be happening, i.e. bond markets should be less responsive to negative macroeconomic news and more responsive to positive news.
A similar analysis as shown in figure 3 but for bonds is presented in fig 6, and suggests that, different to the end of last year, bond investors are finding themselves shorter duration than desired against a backdrop of rising growth momentum. Who has been making the bond market trade on the short side? JPM suspects real money managers, who, as shown in Charts A19 and A20 in the Appendix, appeared to have shifted to significant short duration stance in recent weeks.
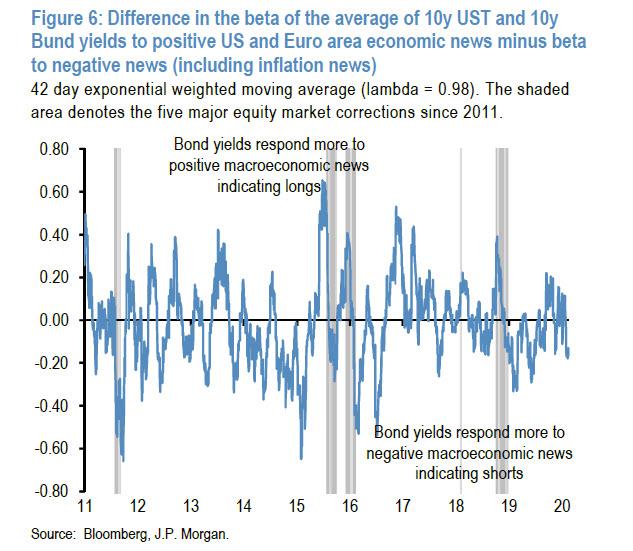
What is also interesting in Figure 6 is how this bond position indicator behaved during equity market corrections. Ahead of each of the past five major equity corrections denoted by the shaded areas, this indicator indicated that the bond market was trading long. But once the equity correction arose and bonds started rallying, the bond market shifted quickly into trading short. In other words, similar to the equity indicator of Figure 3, the bond position indicator has been only useful in retrospect in terms of gauging market vulnerabilities rather than anticipating these vulnerabilities.
In all, JPM’s “alternative position indicators” based on the response of equity and bond markets to economic news, suggest that both markets have been trading short this year. But these indicators have been useful in gauging market vulnerabilities during rather than ahead of market corrections.
Therefore the fact that these indicators have been mostly negative this year does not necessarily reflect investor positioning. In fact, for equities the bank’s position indicator look rather elevated especially among CTAs and Equity Long/Short hedge funds. As such, the way to read these indicators is that in a rising market, investors typically find themselves shorter than desired, but once a correction arises, investors quickly find themselves much longer than desired exposing market vulnerabilities.
Tyler Durden
Sun, 02/16/2020 – 14:30![]()
Zero Hedge’s mission is to widen the scope of financial, economic and political information available to the professional investing public, to skeptically examine and, where necessary, attack the flaccid institution that financial journalism has become, to liberate oppressed knowledge, to provide analysis uninhibited by political constraint and to facilitate information’s unending quest for freedom. Visit https://www.zerohedge.com