
BofA Is “So Bearish, It’s Bullish”, But Here Are The Signs The Top Is Near
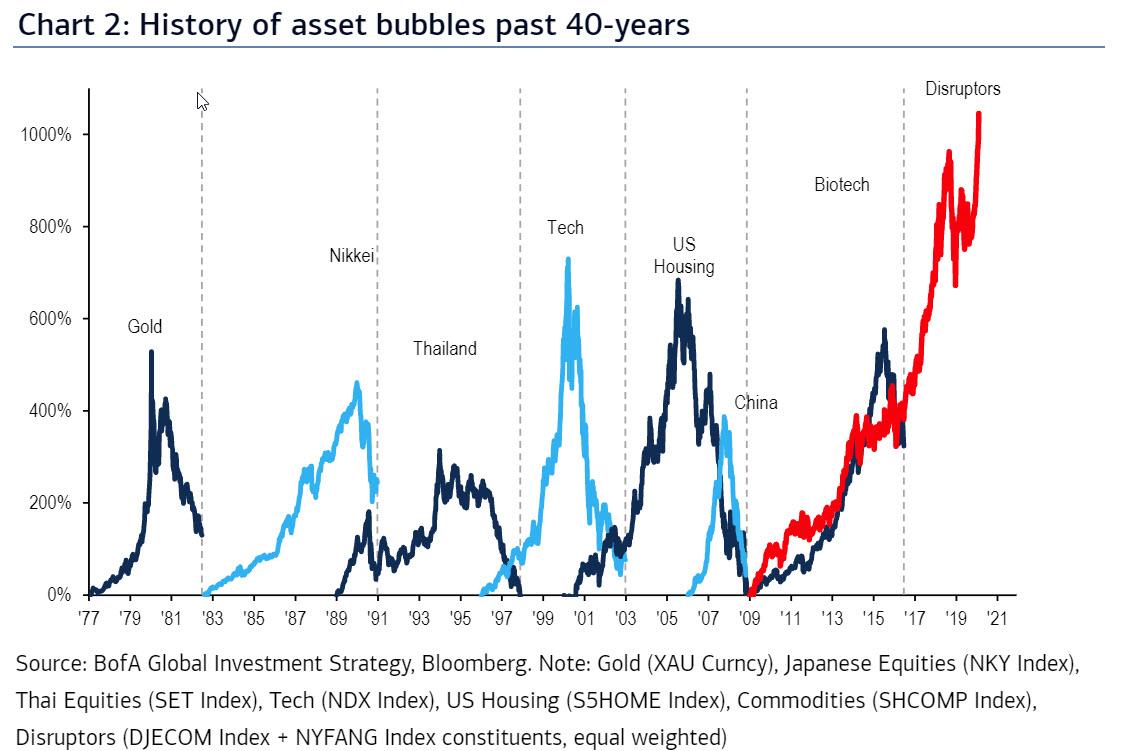
One week after BofA CIO Michael Hartnett pointed out the biggest asset bubble in the central bank era, where so-called tech “disruptors” (which we previously called e-commerce) have now surpassed the relative performance of most prior bubble assets including housing, tech, China and biotech…
… which really is a record bubble in both bonds and stocks, because there is just so much central bank liquidity in the world it ends up going in both risk-on and risk-off assets…
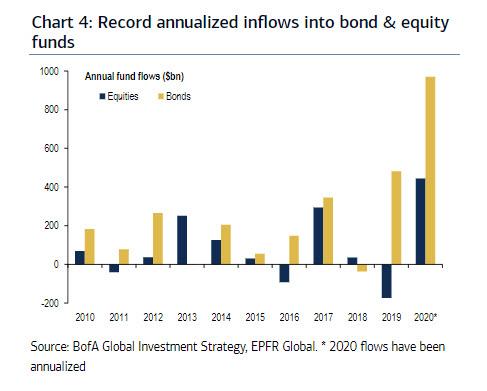
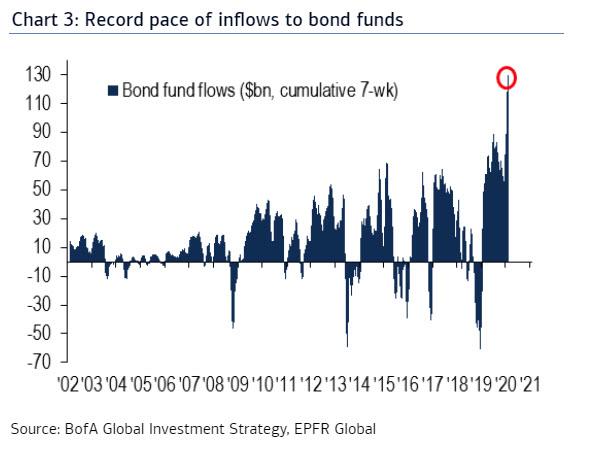
… Hartnett’s latest Flow Show confirms that the dual bubbles kept growing bigger for another week, with another $2.2bn inflow into equities (where tech sticks out like a sore thumb) this week and $18.1bn into bonds, bringing the YTD inflows to bonds to a stunning $130bn.
Some more details on the relentless fund flows into bubble assets:
- Bond bubble: inflows into bonds annualizing at $966bn (vs. record $481bn in ’19), into IG bonds $605bn (vs. record $308bn in ’19).
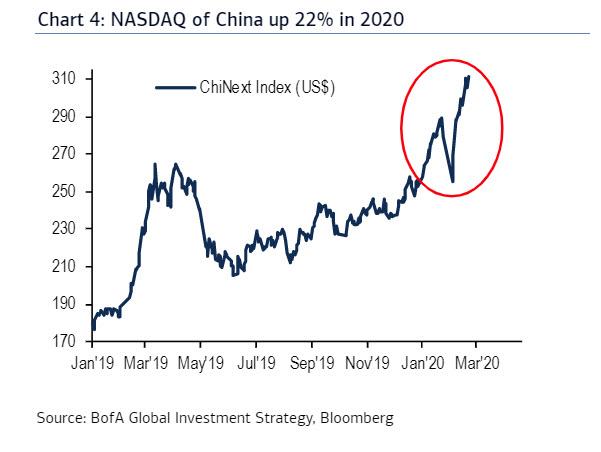
- Tech bubble: inflows into tech annualizing at $62bn (vs. record $18bn in ’17); note despite coronavirus ChiNext index (“NASDAQ of China”) up 22% YTD.
And just to help out the Fed which still sees no sign of the bubbles its policies have created despite “global interest rates at 5,000 lows”, Hartnett points out:
- European IG corporate default risk at record low;
- MAGA (Microsoft, Apple, Google, Amazon) all valued >$1tn;
- Significant moves in Tesla, Virgin Galactic, Stamps.com, palladium;
- Ppassive (e.g. Vanguard & Blackrock) thrusting into private equity & ESG; private equity (Apollo) issuing huge >$2bn CLO;
- Auto lenders (e.g. Ally) buying subprime credit card businesses.
Not surprisingly, Hartnett calls the current bubble era “so 1999”, and refers to the latest FOMC Minutes in which even the Fed goes so far as to warn that “recognizing these limitations (i.e. macro prudential tools), many participants remarked that the Committee should not rule out the possibility of adjusting the stance of monetary policy to mitigate financial stability risks, particularly when those risks have important implications for the economic outlook and when macro prudential tools had been or were likely to be ineffective at mitigating those risks” which is the closest the Fed will go to an “irrational exuberance” warning, and the “combo of new highs in asset prices & rising volatility (e.g. VIX, MOVE)” is so 1999.
Yet it’s not just bubbles: alongside some of the most overvalued assets in history, there are also “so many bear markets”:
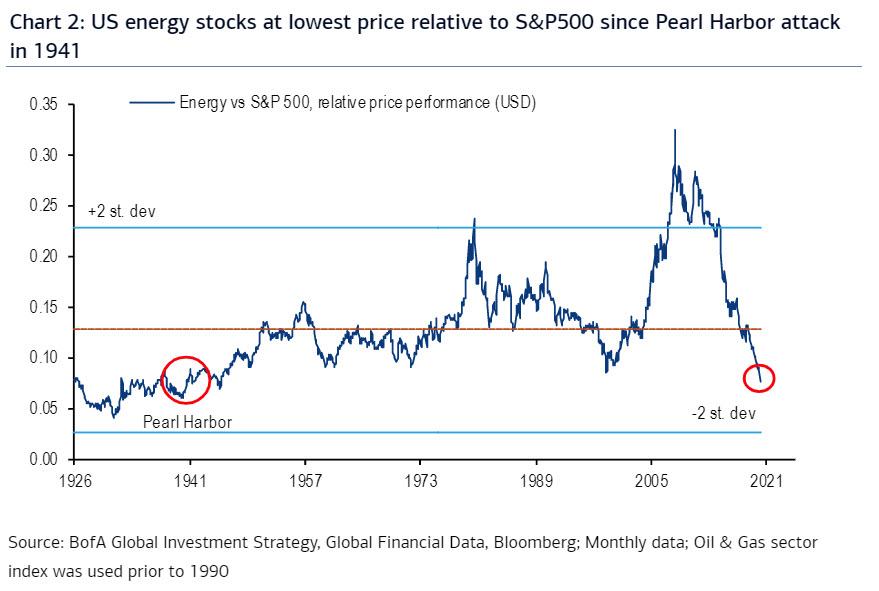
… worst 10-year rolling return from cash & commodities since 1930s, relentless secular relative bear markets in Japanese stocks (since 1989), European stocks (2001), value stocks (2006), banks (2006), China (2007), energy stocks (2008)…US energy sector currently trading at lowest price relative to S&P500 since 1941 (WW2 Pearl Harbor attack – Chart 2).
Commenting on this confluence of giant bubbles and terrifying bear markets, Hartnett says that the “scale of relative bear markets in cyclicals, resources, value stocks is matched by relentless bull market in bonds…since GFC government bond yields have each year on average negatively surprised consensus by 94bps (Chart 7) led by JGBs, which have only seen downgrades to forecasts over past 4-years (Chart 8).”

As a result of this Japanification plus the “inevitable policy shift from Quantitative Easing to Modern Monetary Theory to finance fiscal stimulus in coming years” means everyone now thinks yields stay lower for longer; as a result, Hartnett thinks that the old “floor” of 2% GDP growth, CPI, 10-year bond yields is the new “ceiling”.
Which brings us to his trading view assessment, which is summarized as follows: “All-in on “I’m so bearish, I’m bullish”
As a result of this unmovable conviction in a yield “ceiling” a believe is forming that lower yields = higher stocks, which means that there is now a consensus all-in on “bad news is good news” bandwagon; This means
- bond bubble spill-over to send other asset class prices to irrational levels (happening now);
- “disorderly” rise in yields (>2%) or “disorderly” fall in yields (<1.35%) to incite volatility & risk asset declines (which BofA thinks is actually a much higher probability event).
To be sure, there isn’t anything on the horizon that could push yields sharply higher. In fact, as Hartnett puts it, there are now two economies: i) the cyclical “PMI economy”, which drives EPS & relative asset performance (equities/bonds, cyclicals/defensive), and ii) the secular “GDP economy”, which drives interest rates; “GDP economy” weak. It is the poor global capex numbers despite lower tax rates, lower interest rates, & record corporate profits that confirm the post-financial crisis “GDP economy” just not strong enough for higher rates or yield.
Which is not to say one can’t trade the “PMI economy”, which everything has a price but not always a catalyst. Here Hartnett reminds us that the latest Global Fund Manager Survey shows investors most bullish on Growth>Value since Jul 2008
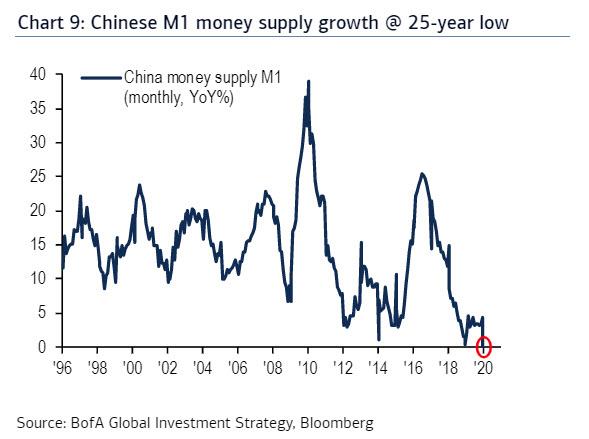
In this light, the key catalyst to unlock a “cyclical value” trade is a giant China stimulus that causes higher yields (e.g. 2009 & 2016); But that is hardly imminent: just watch China’s M1 growth (0%) as lead indicator, currently at lowest level on since 1996 (Chart 9).
So does that mean that nothing will ever drop again? Not at all, and as Hartnett says the “Q2 catalyst for volatility will be disorder in the bond market.” And since some traders need specific catalysts, Hartnett makes it very easy, with the following flowchart on how to trade the bursting of the asset bubble: “we say risk assets trade higher (e.g. S&P500>3498) into Q2, until”:
- peak Positioning…BofA Bull & Bear Indicator >8;
- peak Policy…Fed will buy net $180bn T-bills next 3-months to end-April, to dial-down purchases thereafter;
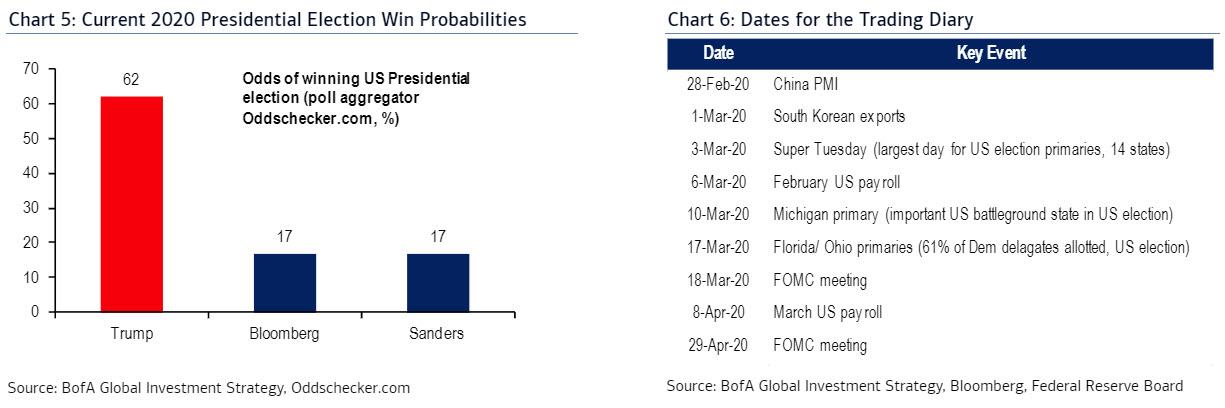
- peak Politics…currently 79% likelihood according to Oddschecker.com (was 42% Nov’19) that 2020 election results in president with pro-business, low tax & regulation platform (Chart 5); Democratic nominee likely visible by March 17th
In other words, the biggest bubble of all time may be just weeks away from the prick heard around the world…
Tyler Durden
Fri, 02/21/2020 – 14:52![]()
Zero Hedge’s mission is to widen the scope of financial, economic and political information available to the professional investing public, to skeptically examine and, where necessary, attack the flaccid institution that financial journalism has become, to liberate oppressed knowledge, to provide analysis uninhibited by political constraint and to facilitate information’s unending quest for freedom. Visit https://www.zerohedge.com