
“Too Early & Still Too High” – Goldman Sees A Bear Bounce, Not A Market Turn
This bear market has been unusual to say the least, not because of the scale of the decline, but rather because of the speed and the volatility.
The average bear market (at least based on US history) experiences a decline of around 35% – very similar to the falls that were seen at the recent low in most markets in the current bear market.
But, as Goldman Sachs’ Peter Oppenheimer notes, the speed of the declines is what stands out as being exceptional; it is hard to believe that the US equity market was trading at a record high just five weeks ago. Its fall into bear market territory (the first 20% decline) took place in record time, just 16 trading days, compared with 44 in 1929, the previous fastest fall. Meanwhile, volatility has been at record levels.
After three consecutive days of moves of +/- 9% (the first such series since 1929), last week posted an 18% three-day rally in the US, and similar moves in many other markets. This was the strongest comparable return in the US since 1933 and in Europe on record.
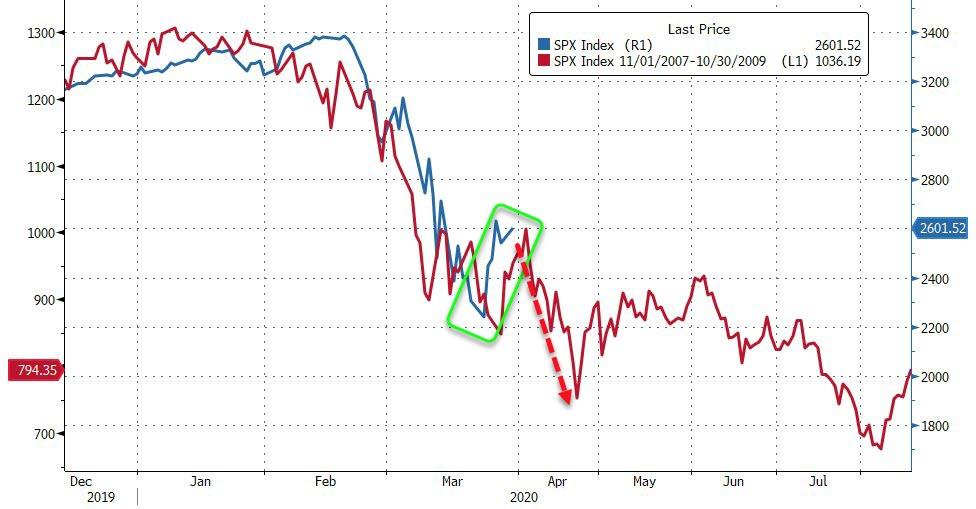
So the question is – is this a bear-market rally to be faded like in 2008? Or is this is the market turn?
Goldman’s Oppenheimer weighs the bull and bear case below, and his conclusion is clear: despite the scale of the policy support, which we agree is a necessary condition for markets to rebound, we think it is too early and the level and valuation of equity markets still too high.
Reasons to be optimistic
Does the rally mark a genuine turning point for equities? The scale of the likely hit to Q2 growth would be historic. Our economists have lowered again their forecasts for Q2, and now expect annualised falls of 34% in the US (over three times worse than the previous biggest quarterly decline in 1958), and over 40% in Europe – similar to the scale of the falls that China experienced in Q1. But many investors would argue that, while unprecedented, these numbers are no longer surprising or even shocking. Most seem to agree that with over 90% of the world’s economies in effective lockdown, it is unsurprising that growth should fall significantly near term. It is what happens after the near-term collapse that the market is starting to discount. On this, there is encouraging evidence coming out of China and some other countries as production and demand start to recover (see China: Update of high frequency trackers on Chinese economic activity, 27 March 2020).
On the policy side, too, there are reasons to be encouraged. The support from both monetary policy and fiscal stimulus has been remarkable both in its size and swiftness. New initiatives have emerged at rapid speed to offset the worst impact of the downturn and to try to ensure a rapid and vigorous recovery. The Fed’s new QE programme is now uncapped and it is supporting markets it doesn’t normally support directly, in particular the commercial paper and credit markets. In effect, the Fed has taken more action than in the entire Global Financial Crisis (GFC) in just a few weeks. The ECB too, has shown more speed and flexibility than in the past. Its new QE package includes loosened criteria over how much debt can be bought in each country, allowing greater support for Italy in particular.
On the fiscal side too, our economists estimate the policy so far announced amounts to 3½% of GDP expansion globally. In addition, there have been government guarantees on loans and workers’ pay. These measures should take deficits to around 8% of GDP in Germany and north of 10% for the US and UK. Meanwhile, Japan has also launched a fiscal package that exceeds that of the financial crisis era, and China, too, is focusing on a new rescue plan. Japan’s ruling Liberal Democratic Party has proposed a stimulus package worth around US$556bn.
Reasons to be cautious
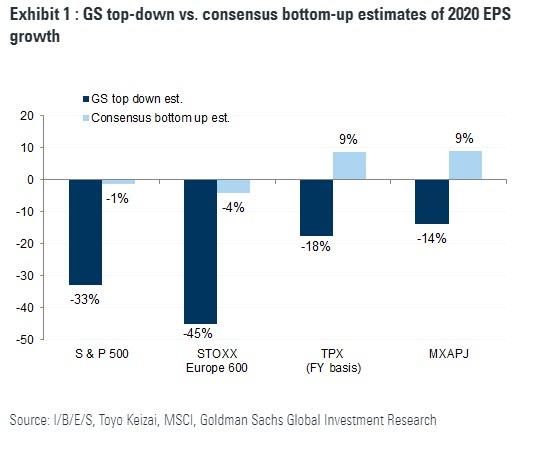
But despite the scale of the policy support, which we agree is a necessary condition for markets to rebound, we think it is too early and the level and valuation of equity markets still too high. Most equity markets, following the recent rally, are down only around 25-30% from their highs and these were highs not just in market levels, but also in valuation. While some valuation metrics have clearly come down from levels at the start of the year, the rally last week suggests that current market levels do not reflect the scale of EPS decline that we are forecasting. For example, we expect falls of 33% in the US and 45% in Europe. The bottom-up consensus numbers are as follows.
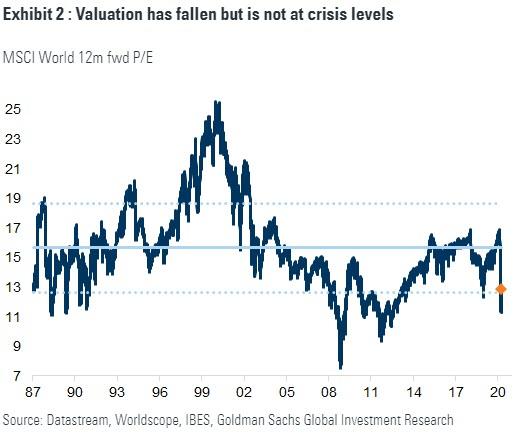
In addition, many of the valuation metrics no not look like crisis-level lows. For example, the European P/E based on consensus forward earnings is now back up to 12x 12m fwd – in the GFC and sovereign debt crisis they fell to a low of roughly 7x and 8x respectively (again both measured on forward consensus estimates).
Some valuation metrics, such as dividend yield, do look cheap, but this may not be enough. Our US strategists forecast S&P 500 dividends will decline by 25% to US$44 per share in 2020. Dividends actually rose by 9% during 1Q. However, they expect a wave of dividend suspensions, cuts, and eliminations will result in dividends declining by 38% during the next nine months so on a full-year basis dividends will be 25% below the level of 2019 — see US Equity Views: Dividends to fall by 25% in 2020: Highlighting 40 stocks for income-oriented investors (median yield of 4.0%), 30 March 2020.
In Europe, meanwhile, the French government has argued that companies in which the government has stakes should not pay dividends, and the government will vote against them during the AGM, while Norway has required financials to stop paying dividends. The German government may also impose restrictions on payouts by companies receiving state aid. Given that 10 of the 50 Euro STOXX 50 companies have government stakes, an apparently high dividend yield may not offer much support for investors.
The timing of any recovery in economic activity is also unclear. Currently our economists are assuming that recovery will start in May/June based on an assumption that we see a peak in the number of those infected and a sharp decline in new infections within the next couple of months. But this may be too optimistic. Furthermore, the rise in unemployment, particularly in the US, may dampen the speed of recovery. Last week’s jobless claims, for example, at over 3m showed the fastest rise in history – roughly 5x faster than the previous record in 1982.
The Bear Bounce
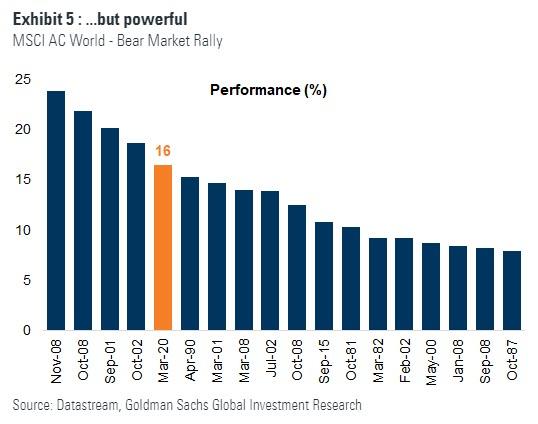
Last week, between March 23 and March 26 the MSCI AC World rallied 16% in 3 days, while the S&P’s rally of 18% was the best 3-day rally since 1933. Last week overall was the strongest weekly performance for MSCI AC World since the GFC.

Our US strategists have shown that bear market rallies are quite common, particularly during the bear market of 2008. For example, between September and December 2008, the S&P 500 experienced six distinct bounces of 9% or more, with some rallies as large as 19%, during the course of between one and six trading days. But the market low did not occur until March 2009, when the pace of economic contraction began to slow.
Below, we extend this analysis to the global equity market.

Taking the experience of the bear markets since the 1980s, including the collapse of the technology bubble in 2000-2002 and the GFC in 2008, we see a pattern of rebounds before the market reaches a trough.
For example, during the GFC there were 6 rallies similar to the one we had last week. Below we show the 18 global bear market rallies since the dot-com bubble.

-
On average, they last 39 days and the MSCI AC World return is almost 15%.
-
Cyclicals outperform Defensives 83% of the time and by 4% on average.
-
We find a similar result at the regional level; EM outperforms DM 67% of the time and by more than 2% on average.
-
There is not a clear pattern in the performance of Value vs. Growth nor Small vs. Large caps.
Why do these bear market rallies occur?
Nothing falls in a straight line, so it would be unusual if there were never rallies within bear markets (or corrections in bull markets). But there are usually two reasons for these rallies:
(i) longer-term expectations of growth are starting to rise, even if short term is still pretty negative; and
(ii) policy measures.
For example, on the second point of policy the clearest one is the rally in end-2008 to early 2009, which coincided with the start of QE: On November 25, 2008, the Federal Reserve announced that it would purchase up to US$600bn in agency mortgage-backed securities (MBS) and agency debt. But that point did not actually mark the trough in equities.
We see the BYs generally rise during these bear market rallies – suggesting the longer-term inflation/real growth expectations are turning. That said, we found that in general our activity indicators are still falling during these rallies and often still fall in the months after they finish – in other words, they are not associated with near-term growth improvement.
* * *
Oppenheimer reiterates his warning from above: despite the scale of the policy support, which we agree is a necessary condition for markets to rebound, we think it is too early and the level and valuation of equity markets still too high.
Tyler Durden
Tue, 03/31/2020 – 09:15![]()
Zero Hedge’s mission is to widen the scope of financial, economic and political information available to the professional investing public, to skeptically examine and, where necessary, attack the flaccid institution that financial journalism has become, to liberate oppressed knowledge, to provide analysis uninhibited by political constraint and to facilitate information’s unending quest for freedom. Visit https://www.zerohedge.com