
S&P Trapped At 3,050 By $4.9 Billion In “Gamma Gravity”
Tyler Durden
Mon, 06/01/2020 – 15:25
Having risen above 3,000 last week for the first time since the covid crash, some have pointed out that spoos now appear bounded by 3,000 on the bottom and 3,065 on the top, with a strange attractor around 3,050.
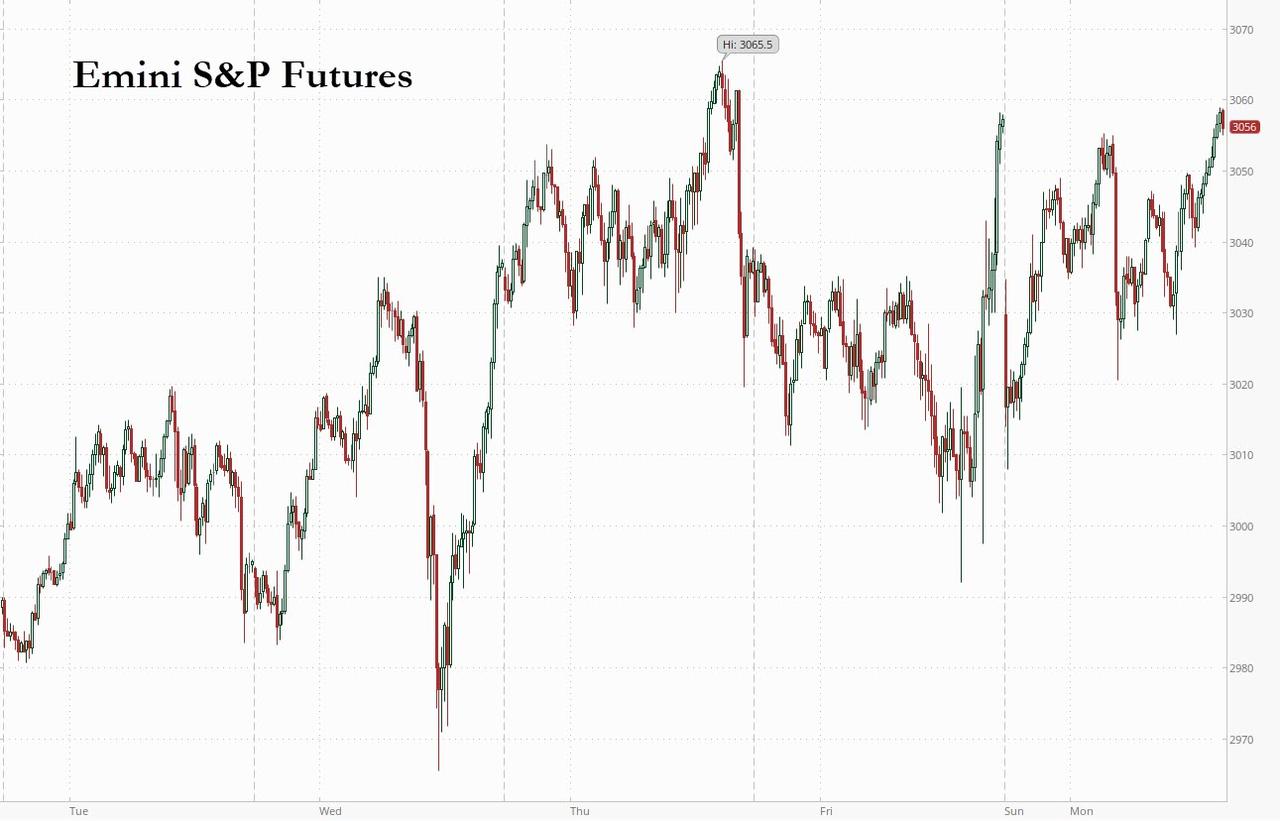
That’s not just an optical illusion based on some scribbles on a chart, because as Nomura’s Charlie McElligott points out in his latest quant update, the “gravity” of the S&P futs 3050 strike remains apparent, with +$1.4B in dealer Gamma at that level, which together with +$1.6B at 3,000 and another +1.9B up at 3,100 is keeping the S&P tightly “surrounded” by dealer positioning.
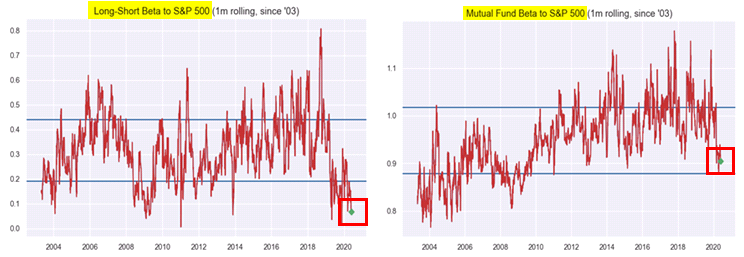
Will the S&P break above the upper limit? The question is who will provide the bid higher, because even as retail investors euphorically chase anything with an upward momentum (as discussed on Friday), fundamental investors still remain skeptical, with both Mutual Fund- and Hedge Fund L/S- beta to SPX shows very low participation. In fact, according to McElligott, Mutual Fund 1-month rolling “Beta to SPX” is now 27.9% percentile since ‘03, while Hedge Fund Long-Short “Beta to SPX” is now a paltry 0.9% percentile since ‘03.
One investor class that did capitulate to the long side last week was CTAs, who as we noted previously, recently flipped from net short to “max long.”
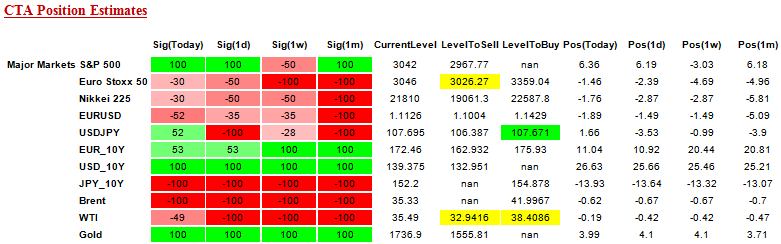
Here is a snapshot of the current positioning across the CTA universe:
- S&P 500 flipped “-50% Short” to “+100% Long” WoW
- Russell 2000 reduced the short from “-100%” to now “-30%” WoW
- Eurostoxx reduced the short from “-100%” to now “-30%” WoW
- Nikkei reduced the short from “-50%” to “-30%” WoW
- KOSPI flipped from “-50% Short” to “+100% Long” btwn Friday and this morning
- EURUSD has now reduced to the short from “-100%” to “-52%” over the past month
- USDJPY has now flipped “-100% Short” to “+52% Long” btwn Friday and this morning
- EGB 10Y (Bund) saw the “long” signal reduced from “+100%” to “+53%” WoW
- WTI has now reduced the legacy “-100% Short” to “-49%” btwn Friday and this morning

In fact, as Nomura has noted, CTA’s and other Managed Futures Funds have been the largest source of demand behind the Equities squeeze/rally in the past few weeks, confirming Citi’s thesis that the bear market rally has been largely driven by a short squeeze, due to an aggregate +$403B notional of futures covering since the March 9th “Max (notional) Short,” with McElligott noting that the overall position across all Equities futs is now essentially “neutral” to a modest “net long” for the first time since March 4th on this mix of covering plus, of course, the outright “max long” in SPX now.
- +$18.6B of Global Eq futs bot vs 1d ago
- +$76.8B vs 1w ago
- +$88.4B vs 2w ago
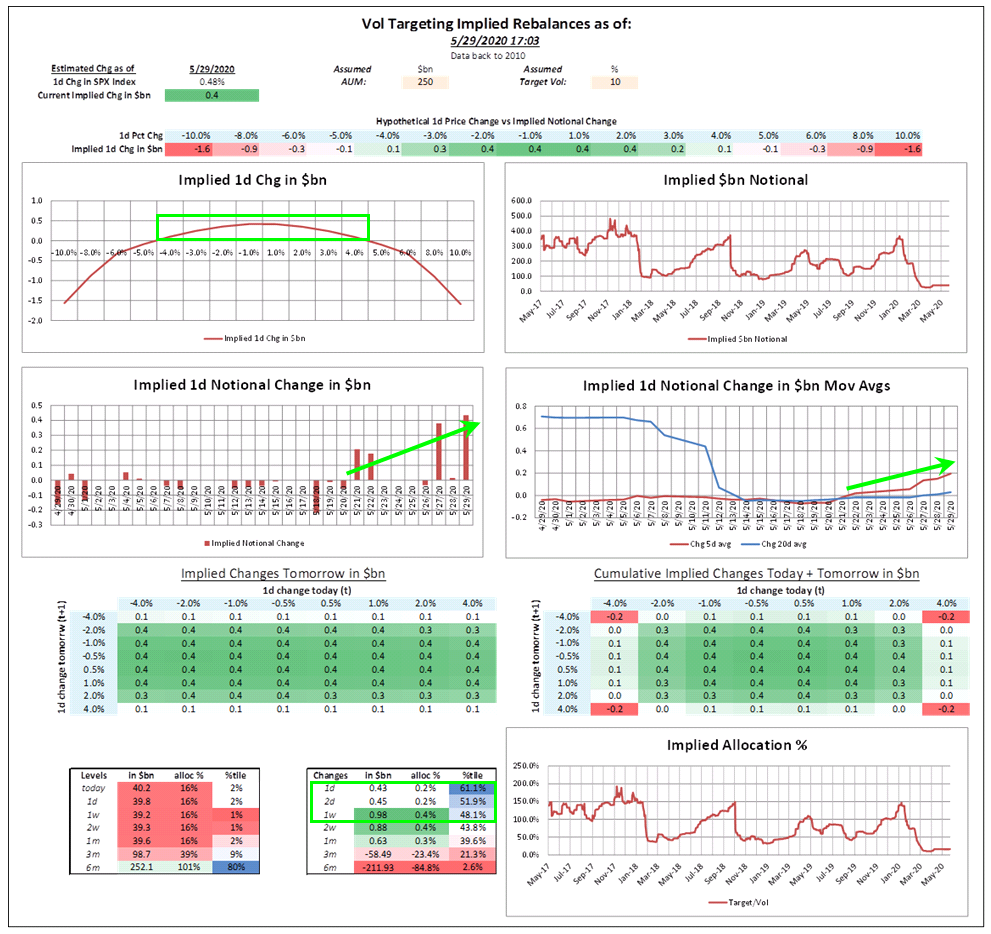
More recently, other systematic funds have joined the buying, with Nomura’s Vol Control fund model estimating $1BN of S&P buying last week (~$430mm Friday alone) and continuing to buy today (barring 4% moves in either direction). Indeed, as McElligott notes, “it’s the “buy impulse” here that matters, as the slow drag lower of trailing realized volatility is in-turn finally dictating a lagged re-leveraging back into Equities exposure, yet remaining at an extreme low “equities exposure” rank—just 2nd %ile since 2010.”
As a tangent, for those curious about the ongoing rebalancing between value and growth, Nomura’s quant believes that the Treasury curve will determine what happens next, as thematic- and factor- direction “will continue to be a story of the shape of the UST yield curve, whereas if further economic reopening optimism leads to sharper “positive surprises” in US data, we will likely see further UST “bear-steepening” which in-turn should act as tailwind to the “Cyclical / Value” stuff which has remained this legacy underweight in the post-GFC period by-and-large.” And vice versa of course. What this suggests is that despite it being a macro level “risk ON,” at the thematic level McElligott sees more of that same hiding place “Momentum” trade being long bond proxies, short cyclicals.
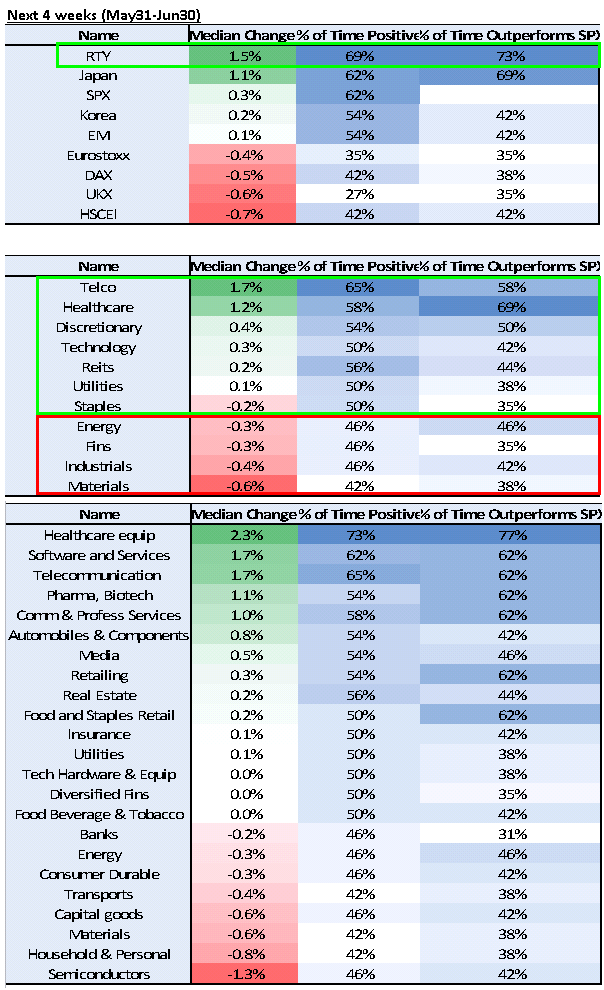
Charlie then focuses on the sequencing of trades during the month of June, where there might be “two trades based around the first two weeks of June being the “historically risk / equities bullish” trade up into Serial / Quarterly June Options Expiration, vs the last two weeks of June being more “defensively” postured.“
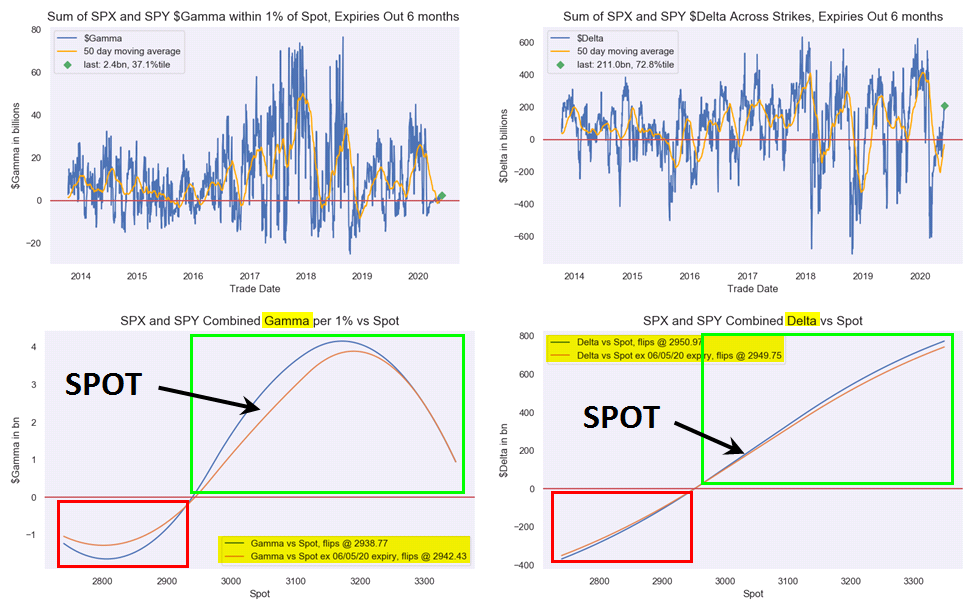
Finally, and going back to the gamma trap that has pegged the S&P around 3,050, the Nomura strategist sees it as “increasingly critical” to monitor whether the current stabilizing force of Dealer “long gamma” and client “long delta” could see that un-clench post Op-Ex and open futures up to a broader distribution of outcomes/wider range thereafter, something we have observed on recent op-ex days in recent months.
And for those asking at what point does gamma turn negative, there is a good 120 points to the downside before selling becomes self-reinforcing, with Gamma flipping negative at a spot price of 2,938.
![]()
Zero Hedge’s mission is to widen the scope of financial, economic and political information available to the professional investing public, to skeptically examine and, where necessary, attack the flaccid institution that financial journalism has become, to liberate oppressed knowledge, to provide analysis uninhibited by political constraint and to facilitate information’s unending quest for freedom. Visit https://www.zerohedge.com