
Here’s What Stock Markets See As The Outcome Of The Nov 3 Presidential Election
Tyler Durden
Wed, 07/08/2020 – 13:54
If one believes online bookmakers such as PredictIt, the November 3 election will be an open and shut case, where Biden just has to show up and say absolutely nothing in order to win.
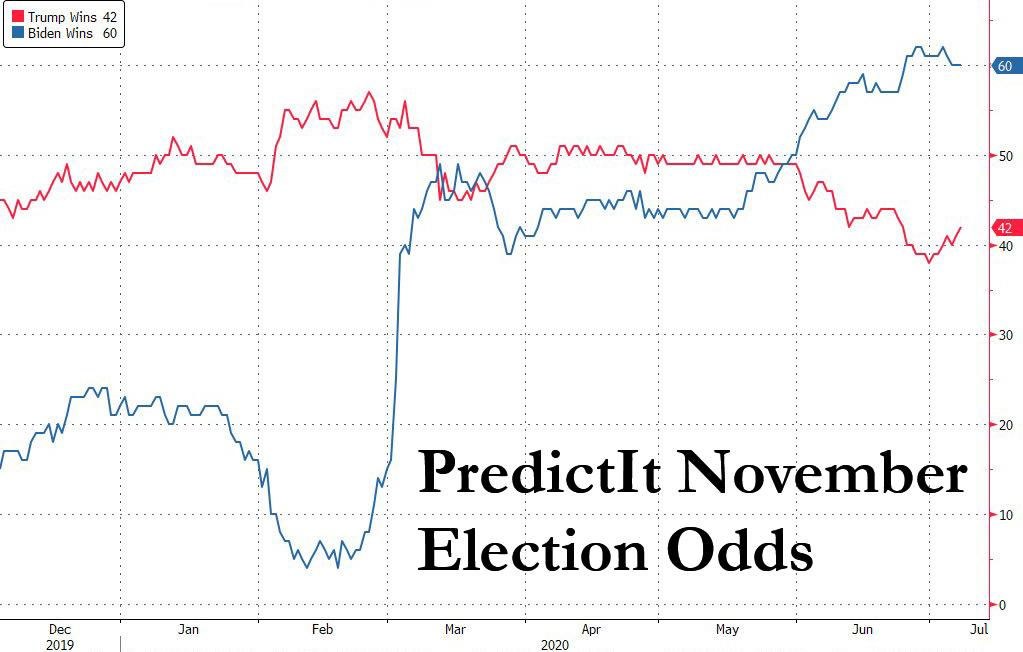
Of course, there are two problems with taking the above at face value: i) it is surprisingly easy to manipulate the highly illiquid PredictIt contracts, and an “entity” with deep pockets can push the odds dramatically in a preferred direction with just a $10-20K in bets; ii) public opinion is extremely fickle and while Biden has so far been completely missing from the public spotlight – an it will be difficult for the vice president to continue doing so until November 3.
That said, public polling also continues to show Biden with a substantial lead less than 4 months ahead of the elections.
National Poll:
Biden 49% (+9)
Trump 40%@YouGovAmerica/@TheEconomist— Political Polls (@PpollingNumbers) July 8, 2020
https://platform.twitter.com/widgets.js
Here too, however, everyone remembers the complete disaster that polling was ahead of the 2016 elections, where formerly reputable media outlets such as the NYT gave Hillary Clinton a 91% chance to win just weeks before the election.

Oops.
Shifting away from openly biased and propaganda attempts to sway voting outcomes, leaves us with just one option: asking what do markets think?
After all, the one place that will be very clearly affected by the election outcome is stock prices. Just one month ago we observed that Goldman’s clients were becoming rather nervous by the possibility of a Democratic sweep, one which according to Goldman’s chief equity strategist David Kostin would result in a substantial increase in corporate tax rates and a 20 point hit to the bank’s 2021 S&P EPS forecast.

So with the Nov 3 election drawing closer, Kostin has readdressed this issue, and in a report published overnight titled “Voting Machine: With four months to go, how US equities are trading the 2020 elections”, the Goldman strategist looks at the possible election outcomes as inferred by various markets, all of which suggest three different 2020 election perspectives:
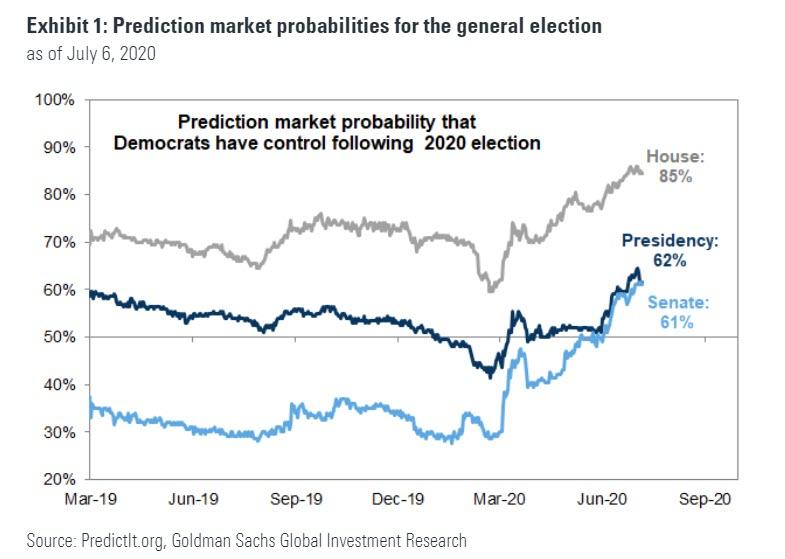
- Prediction markets suggest a Democratic sweep. Market pricing currently implies the Democrats will control the White House, Senate, and House of Representatives. The current probabilities equal 62%, 61%, and 85%, respectively, compared with 43%, 30% and 61% in late February.
- Options market pricing suggests that the winning presidential candidate and control of the Senate may not be known on Election Day and it may take additional time to count all the votes and finalize the results. Implied volatility for the period around the November 3rd election is extremely high compared with prior cycles, primarily because of the coronavirus, but the particularly high level of implied volatility in the periods before and after the election imply an extended period of election-related uncertainty. Although the 20-Nov option expiration offers two additional weeks of cushion beyond 3-Nov, the potential for delayed results, a precedent for extended vote-counting, and a slightly inverted term structure lead us to prefer extending hedges to the 18-Dec quarterly expiration.
- Equity market trading patterns are inconsistent. The current S&P 500 index level and valuation suggest investors are comfortable with the outcome reflected in the polls and prediction markets. However, investors exhibit mixed views inside the market. The performance of stocks sensitive to a potential increase in corporate tax rates has not reflected changing probabilities of the election outcome. In contrast, Health Care stocks have underperformed as the prospect of Democratic control of Washington, DC has increased. One policy initiative that overlaps both parties is infrastructure spending, and stocks likely to benefit have outperformed.
Below we look in further detail at the various market-implied considerations ahead of the elections:
Polls and prediction markets
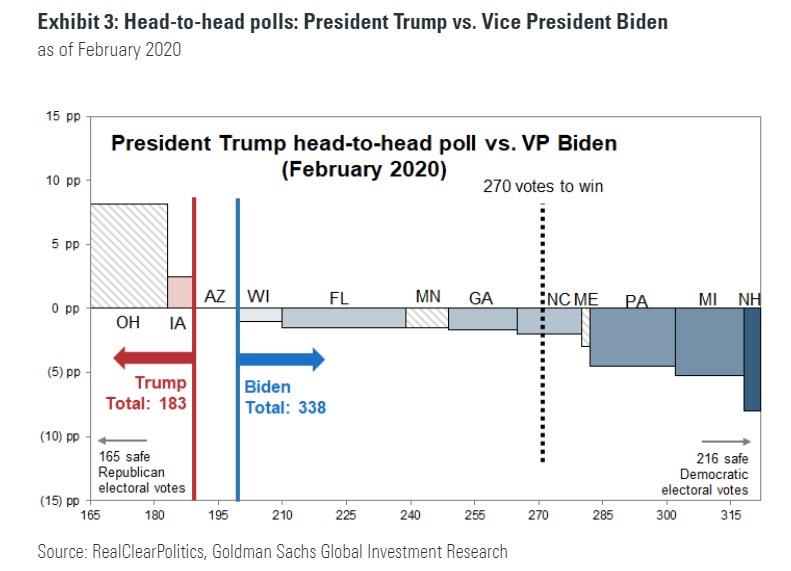
Prediction market-based pricing – such as that derived from PredictIt – implies the Democrats will control the White House, Senate, and House of Representatives. The current probabilities are 62%, 61%, and 85%, respectively, compared with 43%, 30%, and 61% on February 26th, just before Super Tuesday (March 3) and the spread of the coronavirus across the US.
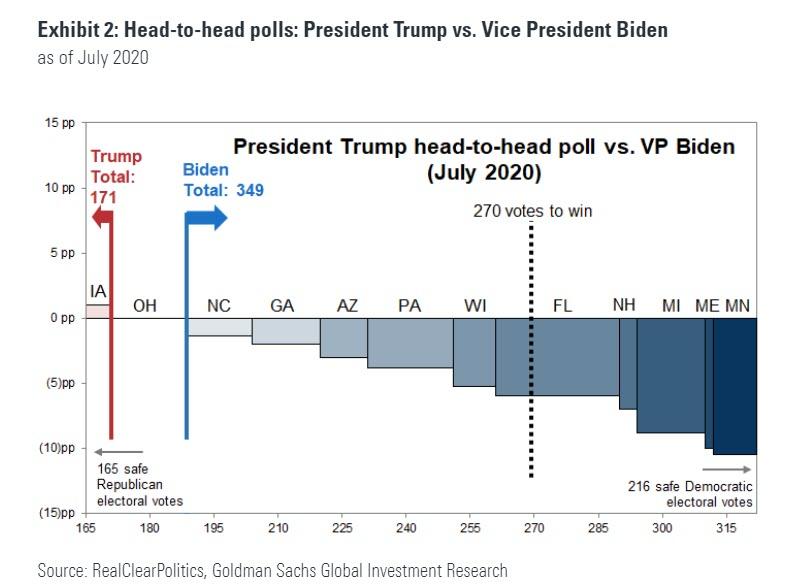
The Real Clear Politics poll average shows presumptive Democratic party nominee Joe Biden with an 8.8 point spread over the incumbent Republican Donald Trump (49.3% vs. 40.5%). FiveThirtyEight shows Biden ahead in a head-to-head election by 9.6 points (51.1% vs. 41.5%).
One additional source of equity market uncertainty in 4Q is that the coronavirus introduces a major complication in the timely tabulation of voting results. Voting and registration data reported by the Current Population Survey show that the proportion of voting done on Election Day has declined from 90% in 1996 to 60% in 2016.

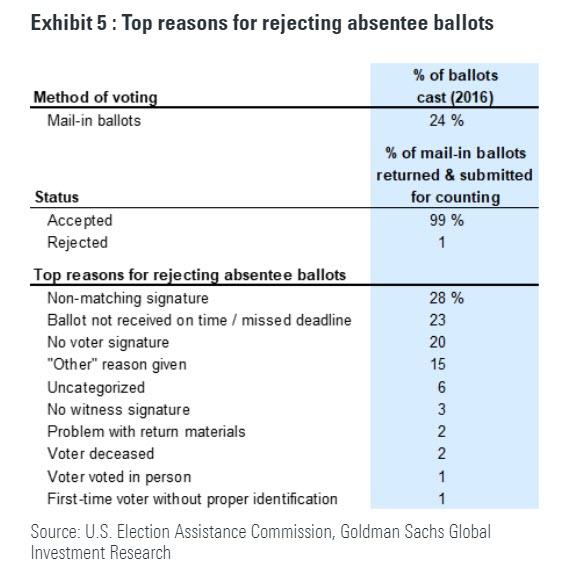
In the 2016 general election, 140.1 million citizens voted, representing a national turnout rate of 63% of the citizen voting age population. Pre-election voting has increased in popularity during the past 20 years. Four years ago, 41% of the ballots were cast before Election Day, with 17% in the form of in-person early voting and 24% via by-mail absentee voting.
Health concerns and social distancing protocols suggest that more voters than ever will decide not to cast ballots at traditional polling stations on Election Day and instead vote by mail. In the case of a close election, it will take time to count – and invariably re-count – all the absentee and mail-in ballots. The deadline for each state to certify its result and finalize electors is December 8th (35 days after the election) or six days before the Electoral College convenes on December 14th (first Monday after the second Wednesday in December). For context, it took 34 days for the winner to be decided in the 2000 contest between George W. Bush and Al Gore.
In its report to Congress on the 2016 election, the US Election Assistance Commission noted that nationally by-mail voting accounted for 24% of all votes cast in the election. The Commission estimates that 99% of ballots “returned and submitted for counting” were ultimately counted in the 2016 election. Exhibit 5 lists the top reasons for rejecting absentee ballots.
However, the resolution of equity market uncertainty is not related exclusively to the presidential election result but is also conditional on the outcome of the various Senate races. Although Presidents can implement executive orders, legislation requires Congressional approval, hence the importance of unified control under a single party of both the legislative and executive branches.
As Goldman reminds its clients, its 2020 US equity outlook report was titled “United we fall, Divided we rise” and refers to the policy uncertainty that may result when one party controls Washington, DC. In contrast, split control suggests gridlock, status quo, and lower uncertainty.
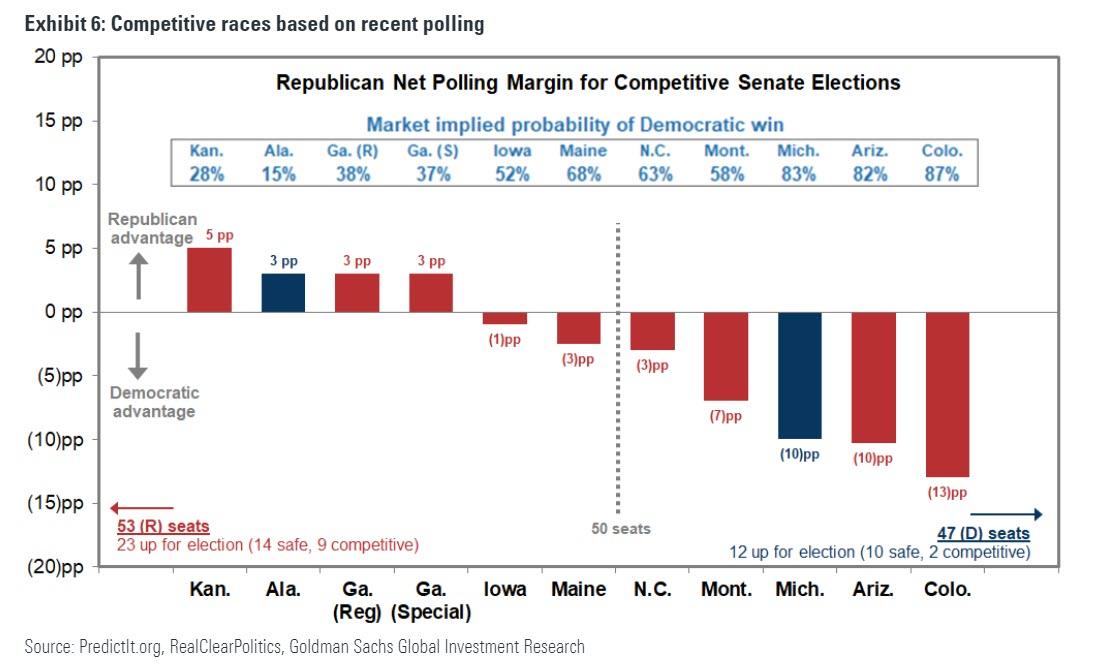
The Republicans currently have a 53-47 Senate majority but have 23 seats up for re-election in November while Democrats have just 12 seats up for re-election.
The latest polls and prediction market pricing indicate the Democrats are likely to capture six seats and lose one seat for a net gain of five seats — enough to gain majority control of the Senate for the first time since 2014. However, as in the case of the presidential election, the winners of close Senate races may not be known until well after Election Day when all the mail-in votes have been counted.
The volatility market’s pricing of election risk
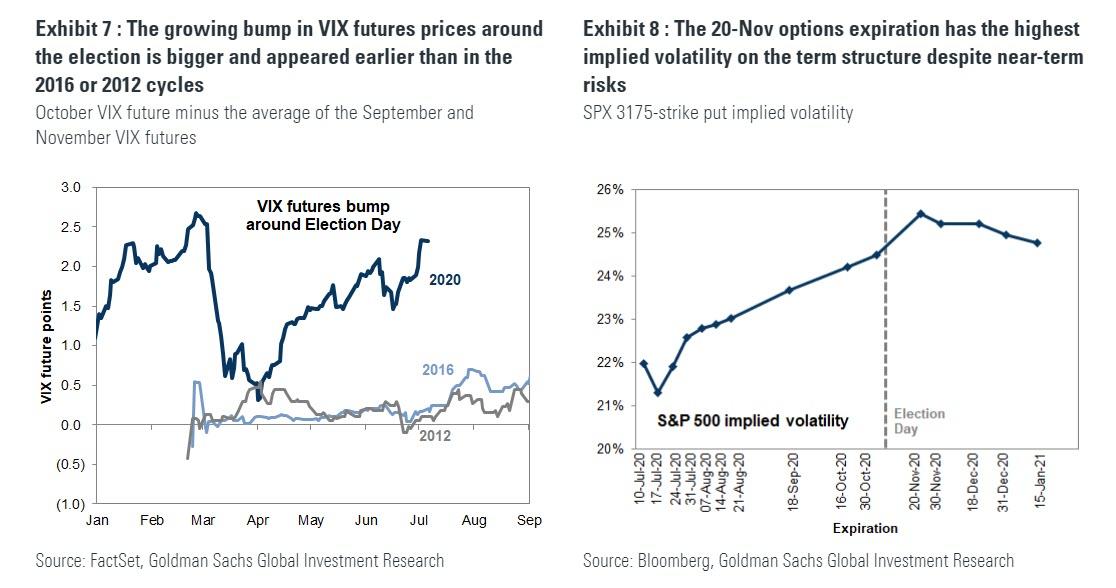
According to Kostin, option markets have been pricing in larger election risk than in prior cycles, and have started pricing election risk earlier. The bump in the VIX futures curve around the November election, which was already unusually large in January but faded during the height of the coronavirus crisis, is now close to its pre-virus high, and much larger than it ever was in the 2012 or 2016 election cycles. This implies that investors expect a close and important election and that more election-related risk is priced into the 21-Oct to 20-Nov period the October VIX future references than any other monthly period this year. Despite heightened near-term risks, including the Covid resurgence and the upcoming expiration of fiscal measures, option markets are expecting volatility to rise between now and November, peaking in the weeks around the November election.
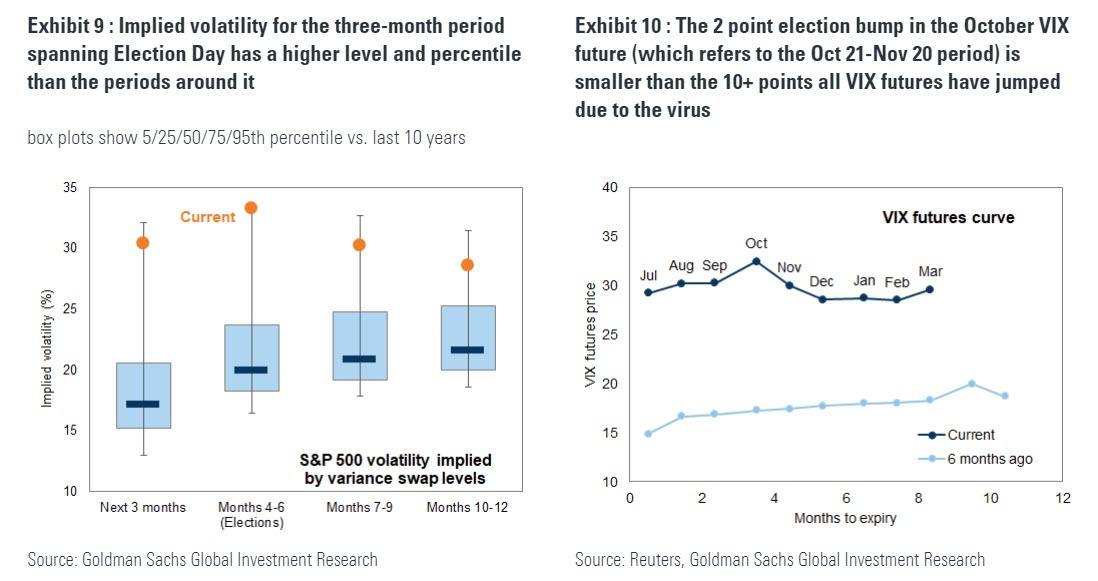
As Goldman adds, election-period hedges are very expensive, primarily because of the market impact of the coronavirus. Implied volatility for the period around November’s election is extremely high, with forward-starting volatility metrics for the three-month period spanning the election in its 97th percentile compared with the last 10 years. Both the level of implied volatility for the period spanning the election and its 10-year percentile are higher than the periods before and after it; however, implied volatility is extremely high across tenors. VIX futures of all maturities are 10-12 points higher than comparable futures were prior to the coronavirus crisis, compared with 2-3 points of extra volatility around the election – implying that most of the extra 4Q implied volatility is a result of the economic impact of the coronavirus.
Although options are pricing more risk in early November than for any other period, they are also pointing toward a volatile election season. The date when election results are known is important to option market participants because it determines which expiration traders should use for hedges. With Election Day less than four months away, the only November expirations that are listed are the third Friday (20-Nov) and the end-of-month (30-Nov), so option markets do not yet contain week-by-week information for the window around the election. Currently, derivative markets are pointing toward a peak level of volatility in the several-week period ending 20-Nov (the highest VIX future references the 21-Oct to 20-Nov period, and the highest implied at-the-money implied volatility in the SPX option market is the 20-Nov maturity, as no earlier expirations in November are listed yet).
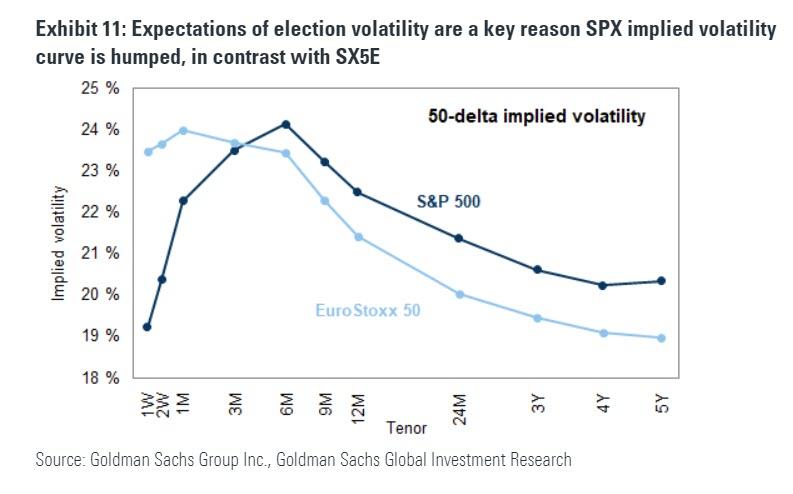
During the last two months, option markets have increased the level of risk expected after 20-Nov relative to the level of risk expected before the elections, indicating that an extended period of high volatility is anticipated. A severe market shock like the coronavirus crisis is typically followed by downward-sloping implied volatility curves as markets price in slow normalization; the unusual humped shape of the SPX curve (upward-sloping between now and the end of 2020, downward-sloping thereafter) points toward high volatility throughout the period around elections. Election risk is a key driver of the difference between the shape of the SPX implied volatility curve and the downward-sloping shape of the EuroStoxx 50’s.
Delayed primary results, a precedent for extended vote-counting, and a slightly inverted term structure lead Goldman to prefer December hedges to November hedges. Given the several-week delay in finalizing the results of the 2000 presidential election (in addition to the contentious 1876 election), the elevated volumes of mail-in ballots used in recent primary elections, and potential for increased mail in ballots this November, Kostin sees heightened risk that election-related volatility could extend beyond Election Day, and while the 20-Nov option expiration offers two additional weeks of cushion beyond 3-Nov, the strategist prefers extending hedges to the 18-Dec quarterly expiration. Currently, the December expiration has somewhat lower implied volatility than the November expiration.
Tax reform
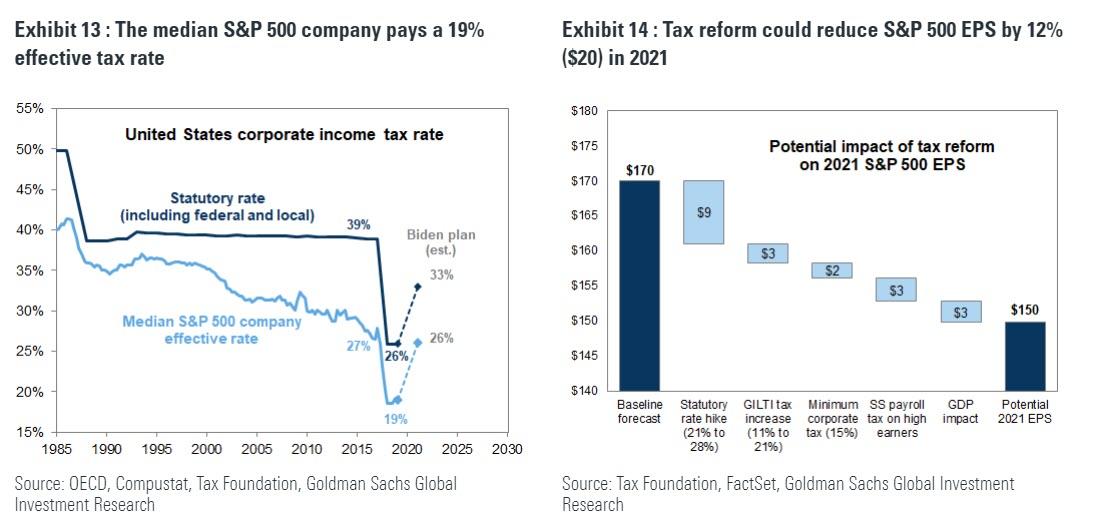
As noted at the top of this article, tax policy has been the potential consequence of the 2020 elections that has garnered the most focus from equity investors thus far. If enacted, Goldman estimates that the Biden tax plan would reduce our S&P 500 earnings estimate for 2021 by roughly $20 per share, from $170 to $150. According to the Tax Foundation, the former Vice President’s plan would raise the statutory federal tax rate on domestic income from 21% to 28%, reversing half of the cut from 35% to 21% instituted by the 2017 TCJA. In addition, the plan would double the GILTI tax rate on certain foreign income, impose a minimum tax rate of 15%, and add an additional payroll tax on high earners. Combined with a drag on US GDP of a similar magnitude to the boost that the TCJA created in 2018, this would reduce Goldman’s 2021 EPS estimate by roughly 12%. Of course, in addition to corporate tax policy, corporate earnings will be sensitive to regulation, trade policy, government spending, and other policy measures.
The recent performance of tax-sensitive stocks does not appear to fully reflect the tightening election race. A basket of stocks that experienced the largest boosts to earnings as a result of lower effective tax rates following the TCJA has outperformed the market in recent months despite surging Democratic odds. Stocks potentially exposed to the minimum tax rate and GILTI rate hike proposals have performed similarly.
The performance of tax-sensitive stocks is not surprising given extremely elevated uncertainty. In late 2017, high tax stocks outperformed sharply only once the TCJA legislation reached its final stages of Congressional ratification despite months of negotiation and drafting beforehand. Today, investors face not only uncertainty regarding the specifics of potential tax reform but also four more months of market volatility before the resolution of a close political race that could eliminate the likelihood of tax reform altogether.

The Biden plan’s proposed changes to the corporate tax code would be complemented by a variety of changes to the personal tax code. These include an increase in the tax rate applied to capital gains and dividends for the highest income individuals. Although the historical sample is small and noisy, more often than not households have decreased equity allocations ahead of capital gains tax rate hikes in the past. Past capital gains tax hikes have also been associated with short-term declines in equity prices as well as the underperformance of high-momentum “winners” that had delivered the largest taxable gains to investors ahead of the rate hike.
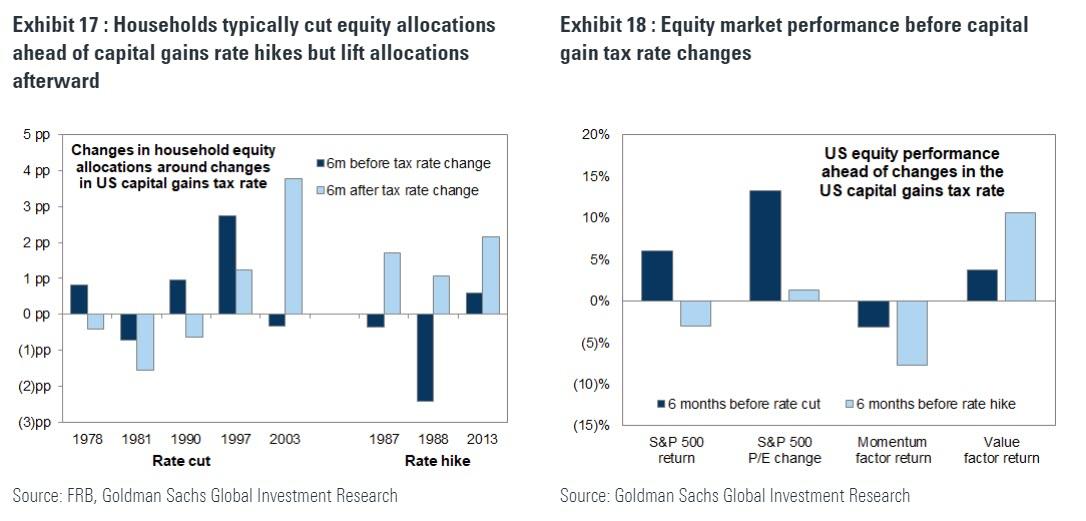
If implemented, any equity market impact of a capital gains rate hike would likely be short lived. Many investors would likely adjust their portfolios in advance of the rate change, particularly if it went into effect late enough to capture the returns for investors who bought near the market bottom in March 2020. However, even with higher tax rates, the growth and yield of equities would remain attractive enough relative to most other asset classes that investors would likely reestablish any equity positions they sold ahead of the tax change (see Valuation at the Lower Bound, June 29, 2020). History supports this view: Household equity allocations have risen during the six months following each of the three capital gains tax rate hikes during the past 40 years.
Health Care policy
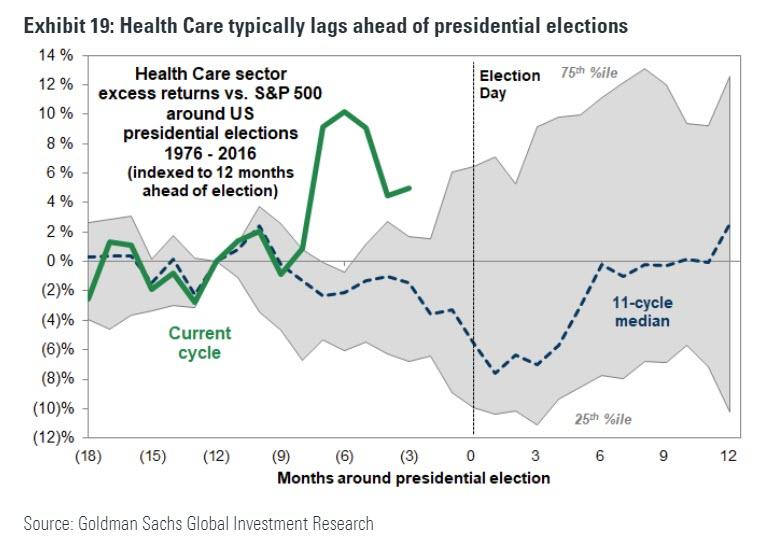
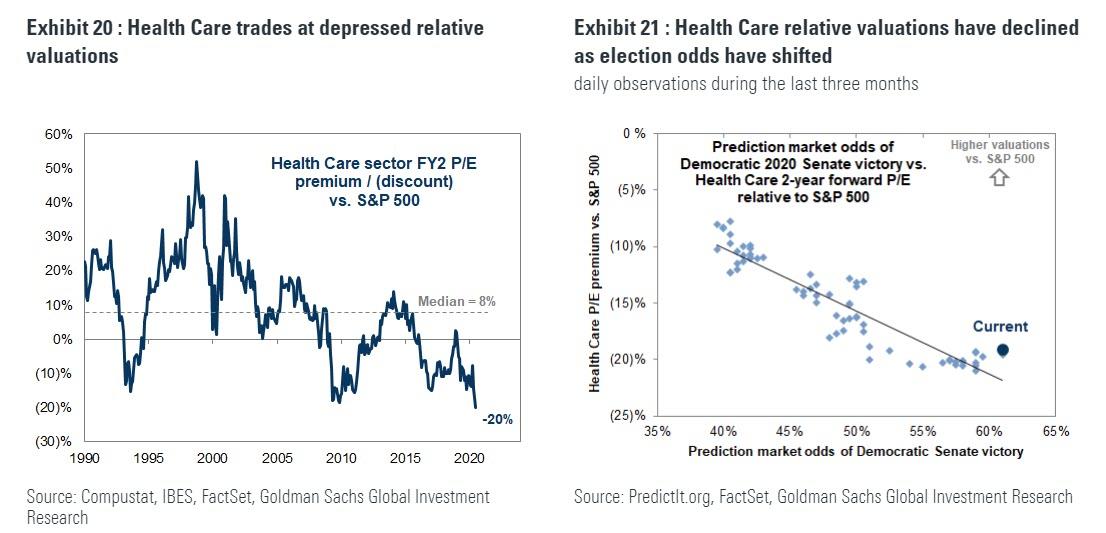
The Health Care sector is one part of the equity market that appears to be pricing election risk. Due to the sector’s elevated exposure to government policy, uncertainty typically weighs on Health Care stocks ahead of presidential elections. This year, the sector has outperformed on the back on its earnings resilience during the pandemic. Bottom-up consensus forecasts current show Health Care EPS growing at a 6% CAGR between 2019-2021, second only to the 7% estimate for the Info Tech sector.
While earnings strength has supported the performance of Health Care stocks so far this year, the sector trades at nearly its lowest relative valuation multiples on record. Its valuations have correlated in recent months with the rise in Democratic election odds, and today the sector appears to be pricing roughly the same likelihood of Democratic Senate victory as the prediction markets. Within the sector, however, the relationship between political risk and stock valuations is less clear. Our Health Care sector specialist has highlighted the difficulty investors face in weighing the impact of the pandemic on earnings against the uncertainty of potential post-election policy changes.
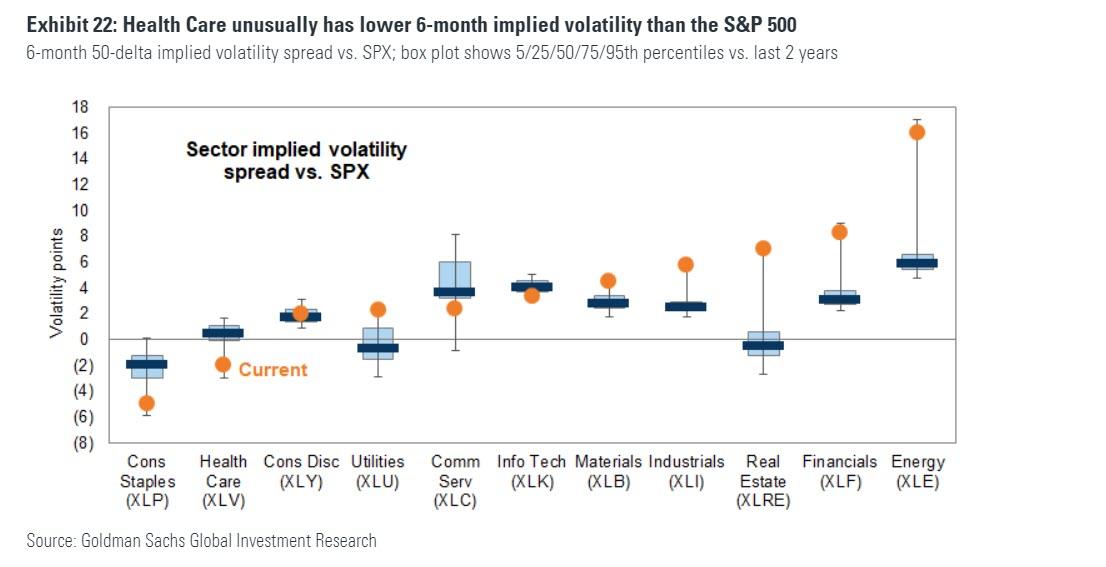
In contrast with stock valuations, the volatility market does not appear to be pricing elevated political risk in the Health Care sector relative to the broad equity market. The XLV Health Care ETF currently has lower implied volatility than the S&P 500, which is unusual relative to history. In fact, the sector has lower implied volatility than any sector except for the defensive Consumer Staples.
![]()
Zero Hedge’s mission is to widen the scope of financial, economic and political information available to the professional investing public, to skeptically examine and, where necessary, attack the flaccid institution that financial journalism has become, to liberate oppressed knowledge, to provide analysis uninhibited by political constraint and to facilitate information’s unending quest for freedom. Visit https://www.zerohedge.com