On The Edge Of Another Historic Inversion: Retail Traders Set To Surpass 50% Of All Call Buying
Tyler Durden
Sun, 09/13/2020 – 13:45
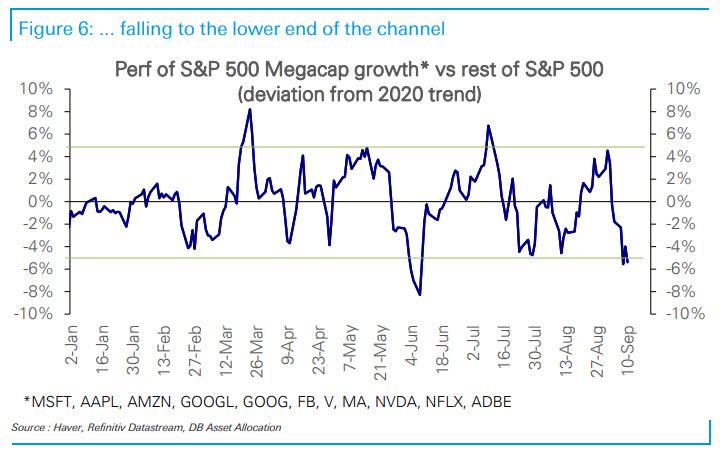
Last week’s market pullback – which led to the fastest ever 10% correction in the Nasdaq from an all time high – was predictably concentrated in mega-cap growth (MCG) stocks, and followed their strong outperformance in August.

The selloff since the new market peak last Wednesday saw the MCG (-12%) put in a sharp correction by this Monday, while the S&P 500 (-7%), its equal weighted counterpart (-4.8%) and XMCG (-4.7%) fell much less.

Yet despite this “relative correction” in the MCGs, Deutsche’s Parah Thatte notes that it has only taken them to the bottom of the range around their very strong trend of outperformance year-to-date (44%).

What was behind this move? Similar to the last pullback in early June, options positioning had become very long by the beginning of this month…
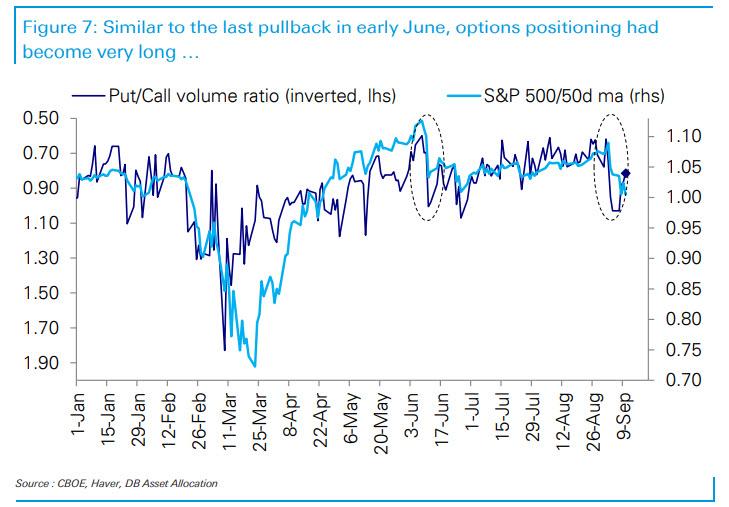
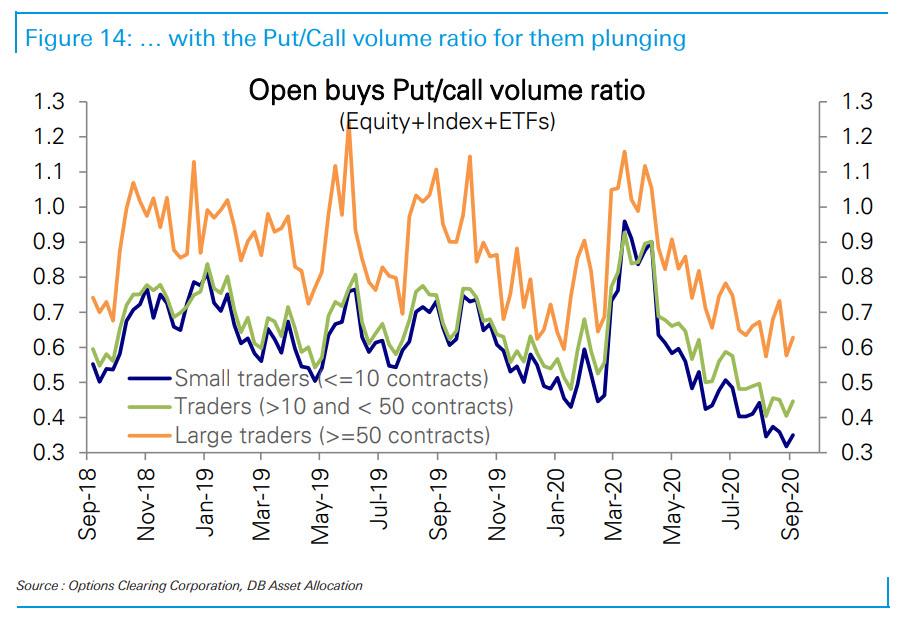
… with the put/call volumes ratio at the bottom of its 10 year range.

This was driven by a rise in calls, while puts were at year-to-date lows.

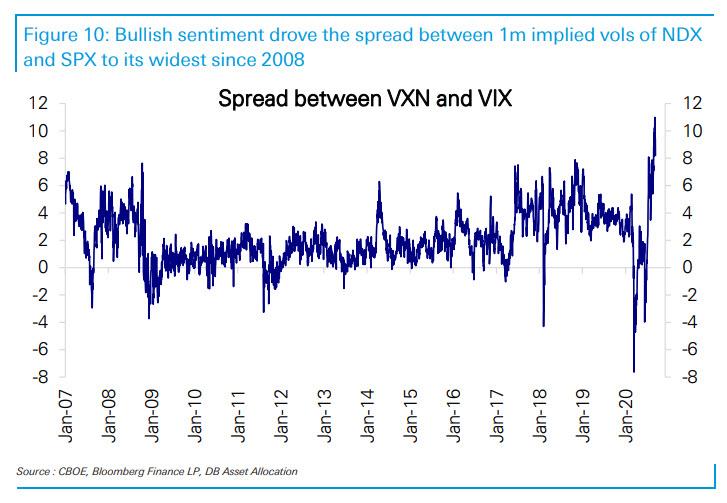
At the same time, the spread between 1m implied vols for the Nasdaq (VXN) and the S&P 500 (VIX) reached its widest since 2008, underscoring the bullish sentiment on large cap growth stocks.
This bullish sentiment and positioning has been narrowly focused, as measures of equity positioning for both systematic and discretionary investors have remained well in underweight territory (17th and 37th percentiles according to DB’s records, respectively).

Of course, while a big part of the recent market volatility was due to SoftBank’s attempt to corner gamma during the sleepy days of August, Thatte notes that bullish options positioning was in fact led by retail investors. OCC data show robust increases in open long calls and open short puts across the board, but led by small retail traders (option sizes of 50 contracts).
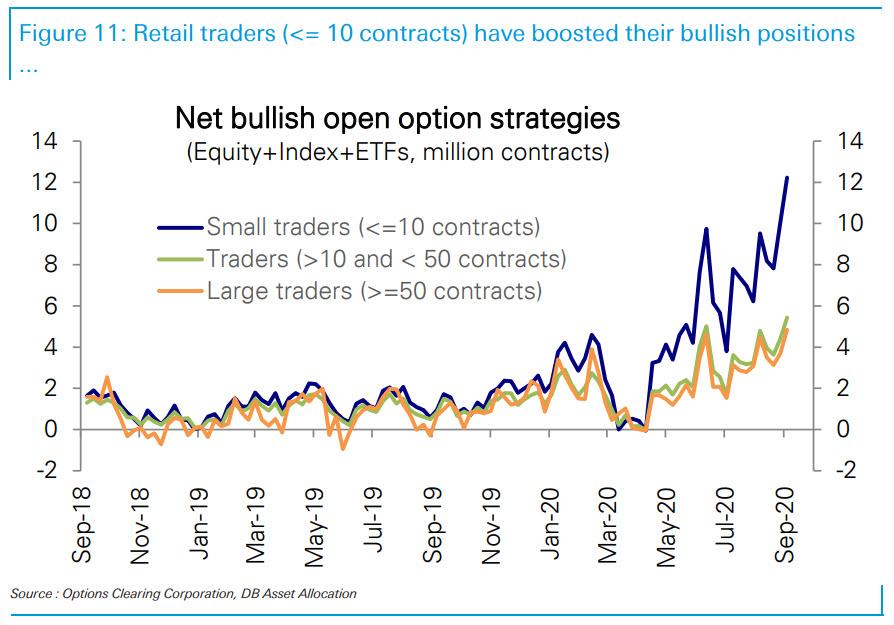
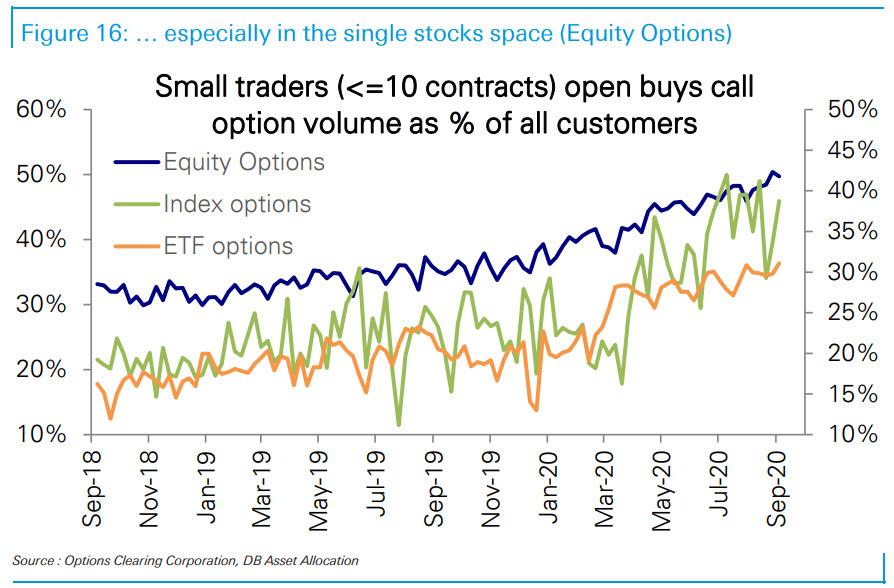
In fact, both Robintrack and OCC data point to these retail traders being much more focused on single stock plays than on index or ETF instruments, something we observed on Friday when we discussed the latest post-correction frenzy in Apple out of the money “lottery ticket” calls driven entirely by retail traders.

In their feverish pursuit of unlimited upside, retail traders have given up on any hedging – thanks to the Fed which virtually everyone, both institutions and daytraders, now expects will step in and reverse any new market crash – and the put/call ratio among retail investors (<10 contracts) is the lowest on record among all investor classes.
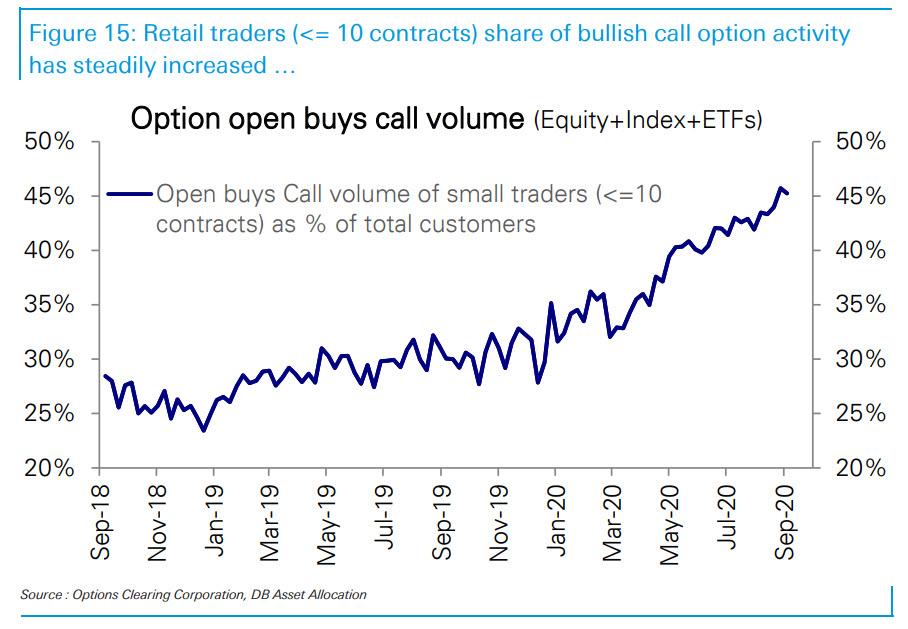
The retail call-buying frenzy has accelerated to such an extent that as the following stunning chart from Thatte shows, retail traders are on pace to soon have a majority share in all bullish call option activity (currently at 45% and up from 30% at the beginning the year), concluding the process we first discussed in May in “How retail investors took over the stock market“…
… and especially in single stocks as shown in the next chart.
This means that two months after we reported of a historic inversion in the market, when as Goldman first observed the average daily value of options traded has exceeded shares for the first time amid an unprecedented surge in single stock trading volumes…
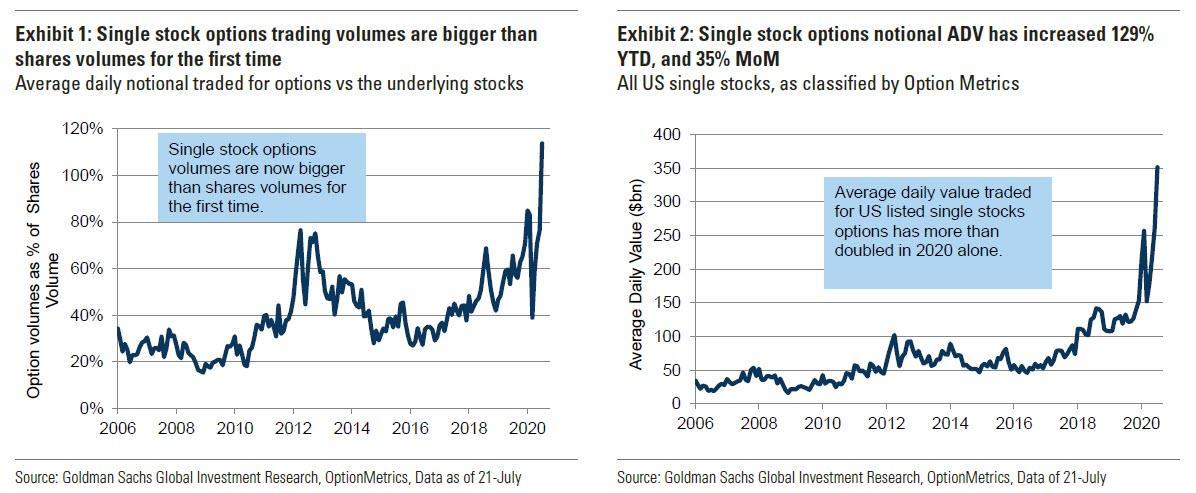
… we are on the cusp of another historic inversion, one where retail daytraders fully cement their role as the dominant price setters in the call space, at least until we have a sufficiently powerful market crash to deter such frenzied momentum chasing. Because clearly last week’s shallow correction – which was quickly BTFDed – was not enough.
* * *
Finally, while it appears that nobody can stop talking about the rising role of retail traders (with or without their SoftBank synergies), here are some observations on what the other key players in the market did in the past week, courtesy of Deutsche:
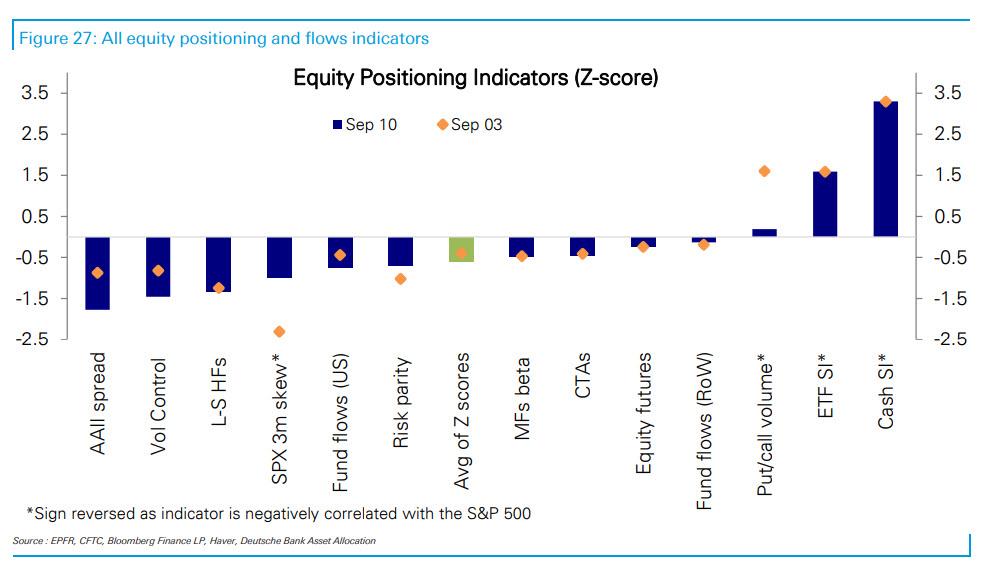
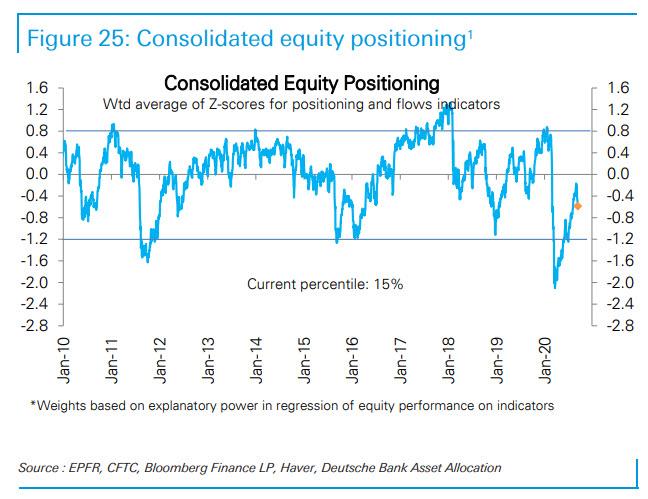
- The aggregate equity positioning measure fell a bit over the week and is now in the 15th percentile. Discretionary strategies positioning fell slightly from a 6m high, driven by a sharp fall in the AAII bull-bear spread and weak US equity funds flows. Systematic strategies positioning, which is more sensitive to realized market volatility, also fell a bit and is now in the 14th percentile.
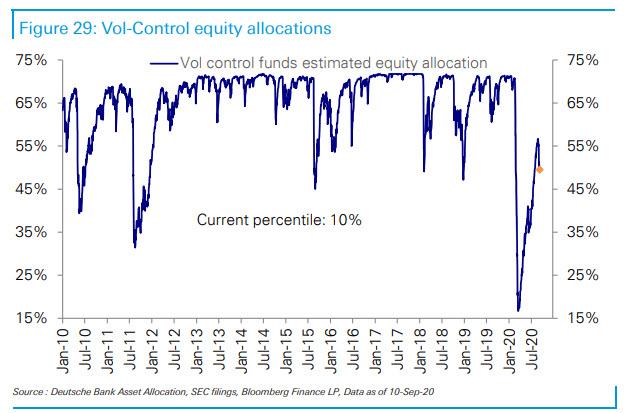
- Vol Control funds’ equity allocations fell by ~$17bn during this latest bout of volatility. Vol control funds, which are most reactive to changes in vol, cut their equity exposure to 50% (vs their maximum equity allocations around 72%). SPX realized volatility crept up closer to the already elevated implied volatility, prompting the funds to cut their equity exposure. Nonetheless, the sell-off was a measured in part from the lower sensitivity of the funds to volatility changes, as VC equity allocations were only in the 15th percentile of their 10Y history at the start of the month.
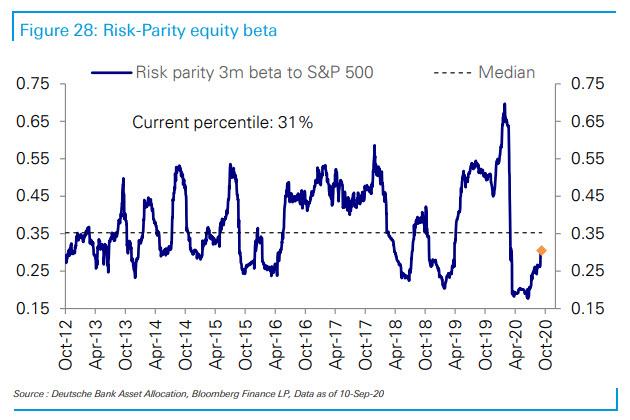
- Risk Parity funds did not see a notable decrease MTD in their equity allocations. Risk Parity managers are generally slower to respond to quick market shifts than other systematic strategies in our view. In addition to bond-equity return correlation falling over the past week, equity realized volatility did not spike to the extent that implied volatility did. Furthermore, volatility across most other asset classes excluding equities was relatively muted, alleviating pressure for now on RP funds to quickly cut their overall portfolio exposure.
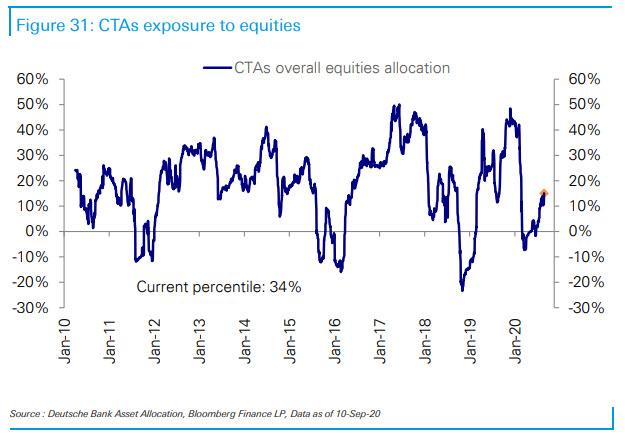
- CTAs allocations to S&P 500 saw marginal cuts, while Nasdaq 100 exposure was trimmed to the lowest level since March. Key short-term technical support levels have not yet been breached for most equity indices, capping equity exposure cuts by CTAs for now.
![]()
Zero Hedge’s mission is to widen the scope of financial, economic and political information available to the professional investing public, to skeptically examine and, where necessary, attack the flaccid institution that financial journalism has become, to liberate oppressed knowledge, to provide analysis uninhibited by political constraint and to facilitate information’s unending quest for freedom. Visit https://www.zerohedge.com