US Household Wealth Hits All-Time High As “Top 1%” Have Never Been Richer While Poor Drown In Debt
Tyler Durden
Thu, 12/10/2020 – 13:04
The Fed’s latest Flow of Funds report released at noon today showed the latest snapshot of the US “household” sector as of Sept 30 2020. What it showed is that one quarter after the biggest surge in household net worth on record when US household net worth jumped by $7.6 trillion to $119.0 trillion (which followed the record drop in net worth in Q1 when $8 trillion was wiped out), in the 3rd quarter of 2020, the net worth of US households rose another $3.82 trillion to a record $123.5 trillion.
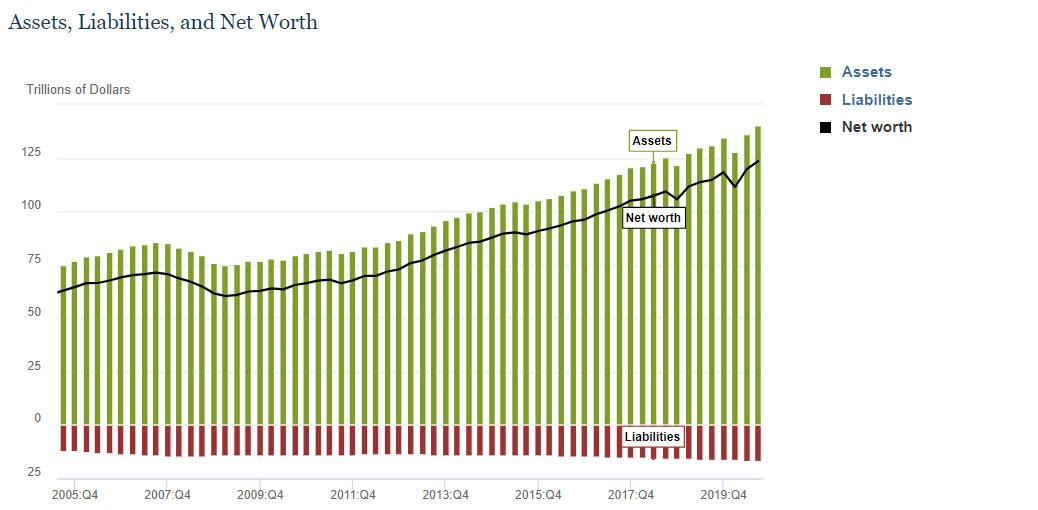
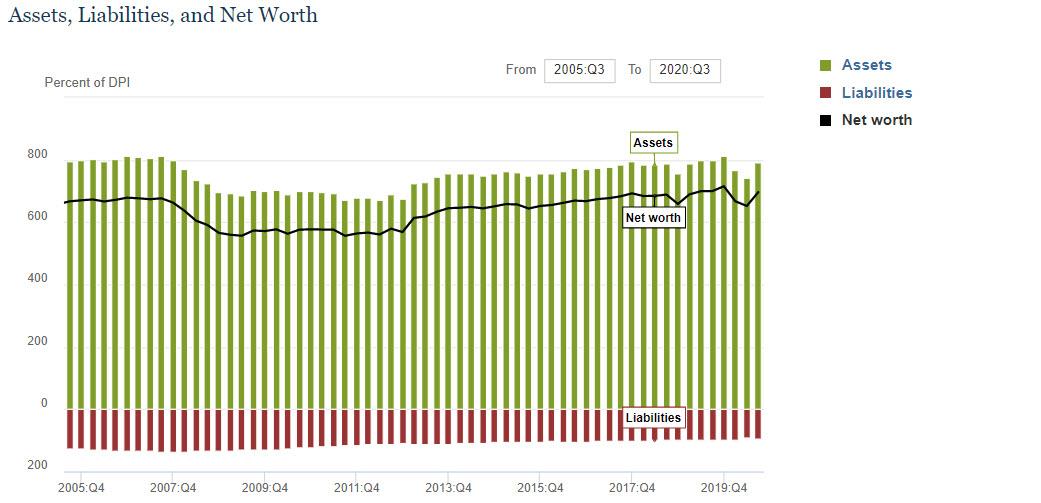
As a percentage of Disposable Personal Income, total assets rose back to a near all-time high of 791% of DPI, while net worth was 696% of disposable income, also just shy of all time high.
As usual, the biggest swing factor was in the value of market-linked securities: in Q3, the value of directly and indirectly held corporate equities increased by $2.76 trillion due to the continued surge in stock prices (after the record $6.19 trillion increase in Q2), while the value of real estate held by households by a far more modest $430 billion. The high rate of personal saving also contributed to the increase in net worth, while the value of real estate held by households increased modestly. Homeowners’ real estate holdings minus the change in mortgage debt rose $288.3 billion (a positive value indicates that the value of real estate is growing at a faster pace than household mortgage debt).
<!–[if IE 9]><![endif]–>
On the liabilities side, total credit rose 3.8% with household debt surging 5.6% to $16.4 trillion, driven by the biggest quarterly increase in mortgage debt since 2007.
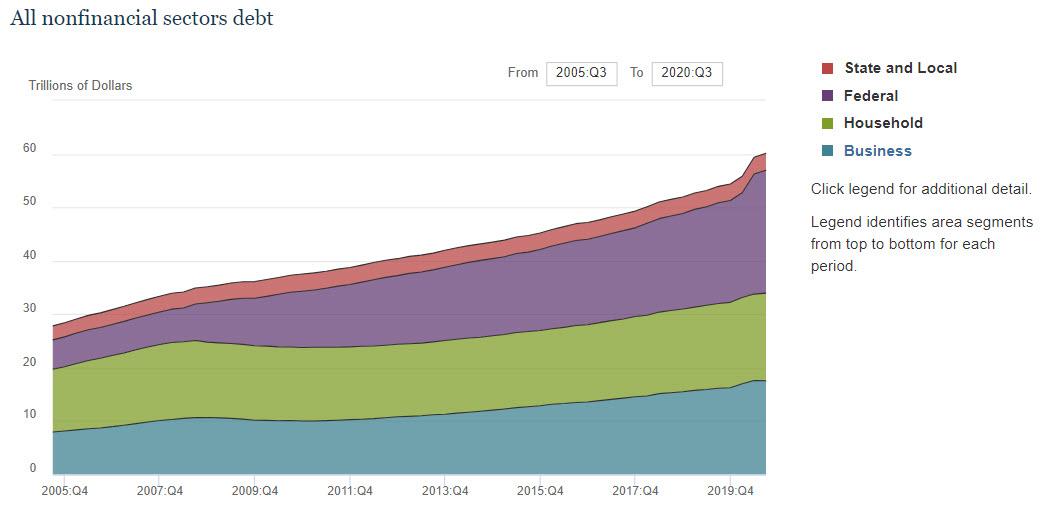
At the same time, Q3 business debt decreased by more than $38 billion from the prior quarter, or at an 0.9% annualized rate, in the July-September period to a total outstanding $17.5 trillion. It marked the first decline since the end of 2010. Federal debt outstanding rose about $511 billion, or an annualized 9.1%, to almost $23 trillion. Finally, foreign credit rose 3.2% to $4.593 trillion.
Finally, consumer credit not including mortgage debt rose by almost $20 billion in the third quarter after declining in the previous three-month period for the first time since 2015.
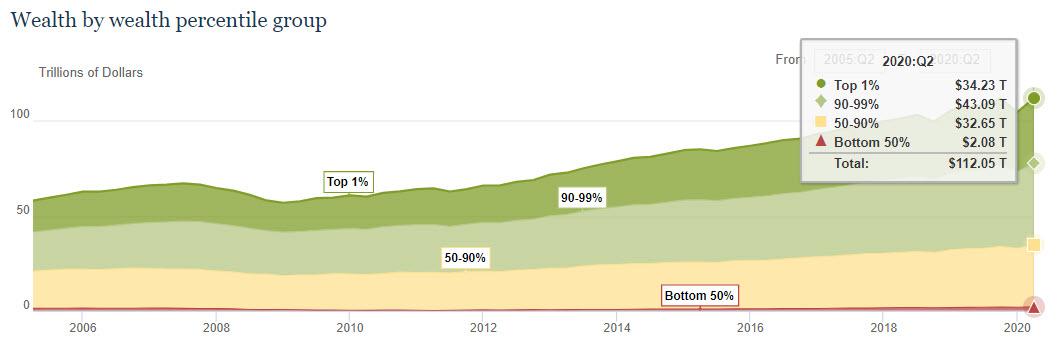
The bottom line is that (especially if one ignores the debt – which clearly will be monetized or hyperinflated by the Fed before it all comes crashing down) the US economy has never been stronger. And while it would be great news if wealth across all of America had indeed risen as much as the Fed claims, the reality is that there is a big catch: as shown previously, virtually all of the net worth, and associated increase thereof, has only benefited a handful of the wealthiest Americans.
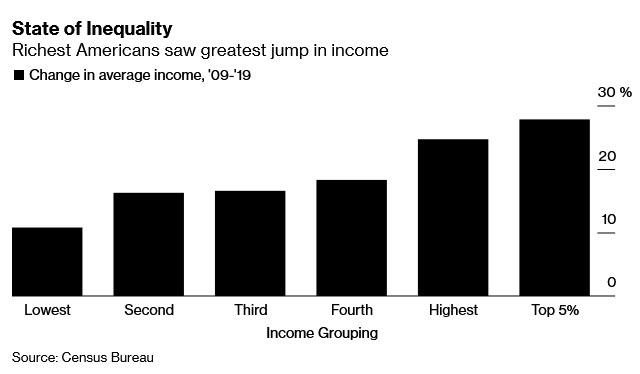
According to a record Census Bureau report, over the past decade, during an economic expansion that benefited most Americans, the richest made out the best. In fact, the CB found that the top 5% of households – those making $451,122 on average last year – have seen their inflation-adjusted incomes jump 28% since 2009.
The gain – which helped push inequality to the widest in decades – compares with a mere 11% rise for the bottom 20%, whose income rose to about $15,290 from roughly $13,800 a decade ago. Those in the middle groups – who made between $40,600 and $111,100 last year – saw their incomes rise between 16% to 18%, the data show.
A separate breakdown of the change in net worth, as also discussed previously, one which looks at median net worth by age of head (of household) shows that the oldest Americans – those 65 and older – have seen gains in their net worth by over 60%, while everyone else is either flat or down!

This underscores just how endemic poverty is in America, even in times of economic expansion. While incomes have increased, so has the cost of living, with consumer prices rising 20% since 2009. Meanwhile, while financial assets – those which have grown the most in the past decade – soaring thanks to the Fed’s generous monetary policy and benefiting those who own financial assets, this turns out to be a tiny sliver of the population. In the CBO’s latest, if somewhat dated, Trends in Family Wealth analysis published in 2016, the budget office showed a breakdown of the net worth chart by wealth group, which sadly shows how the “average” American wealth is anything but, and in reality most of that $100 trillion belongs to just 10% of the US population. The distribution has only gotten worse since then.
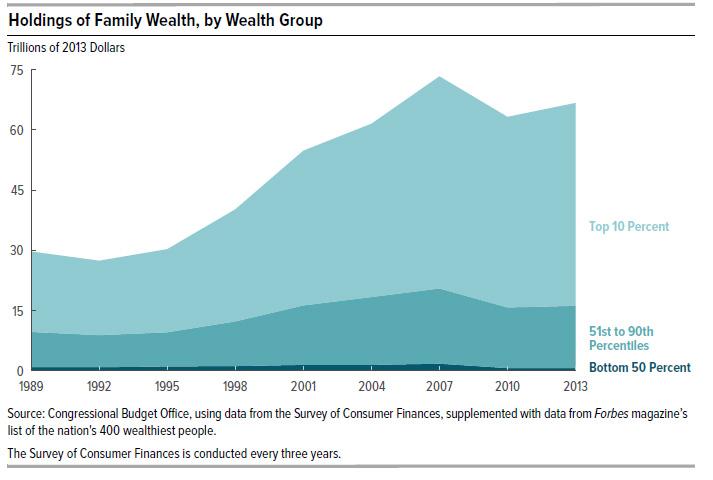
Here is how the CBO recently explained the wealth is distributed:
- In 2013, families in the top 10 percent of the wealth distribution held 76 percent of all family wealth, families in the 51st to the 90th percentiles held 23 percent, and those in the bottom half of the distribution held 1 percent.
- Average wealth was about $4 million for families in the top 10 percent of the wealth distribution, $316,000 for families in the 51st to 90th percentiles, and $36,000 for families in the 26th to 50th percentiles. On average, families at or below the 25th percentile were $13,000 in debt.
In other words, roughly 75% of the $7.6 trillion increase in assets went to benefit just 10% of the population, who also account for roughly 76% of America’s financial net worth. It also means that just 10% of the US population is worth roughly $90 trillion, while half of the US population was virtually no wealth, and if anything it is deeply in debt.
Even worse, when looking at how wealth distribution changed since the 1980s, an even more dire picture emerges: family wealth grew at significantly different rates for different segments of the U.S. population. In 2013, for example:The wealth of families at the 90th percentile of the distribution was 54% greater than the wealth at the 90th percentile in 1989, after adjusting for changes in prices.
- The wealth of those at the median was 4 percent greater than the wealth of their counterparts in 1989.
- The wealth of families at the 25th percentile was 6 percent less than that of their counterparts in 1989.
- As the chart below shows, nobody has experienced the same cumulative growth in after-tax income as the “Top 1%”
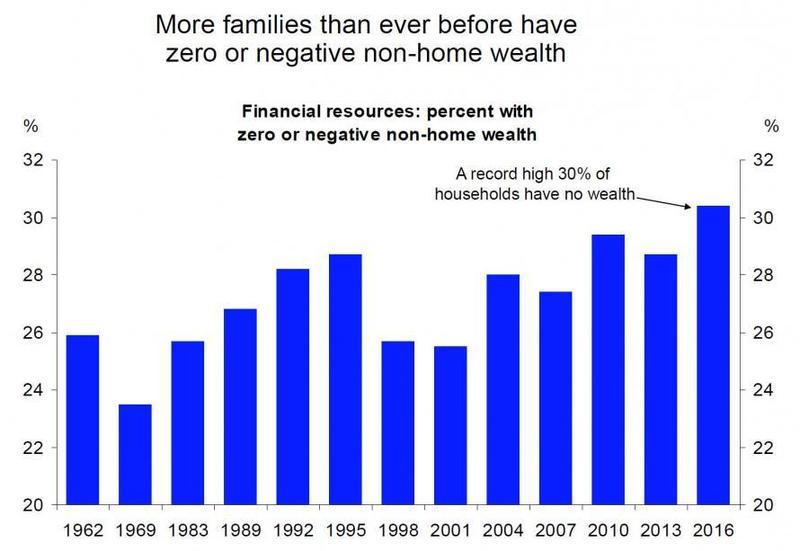
The above is particularly topical at a time when both parties is trying to take credit for any fledgling US recovery. Here, while previously Democrats, and now Republicans tout the US “income recovery” they may have forgotten about half of America, but one entity remembers well: loan collectors. As the chart below shows, America’s poor families have never been more in debt.
The share of families in debt (those whose total debt exceeded their total assets) remained almost unchanged between 1989 and 2007 and then increased by 50 percent between 2007 and 2013. In 2013, those families were more in debt than their counterparts had been either in 1989 or in 2007. For instance, 8 percent of families were in debt in 2007 and, on average, their debt exceeded their assets by $20,000. By 2013, in the aftermath of the recession of 2007 to 2009, 12 percent of families were in debt and, on average, their debt exceeded their assets by $32,000.
The increase in average indebtedness between 2007 and 2013 for families in debt was mainly the result of falling home equity and rising student loan balances. In 2007, 3 percent of families in debt had negative home equity: They owed, on average, $16,000 more than their homes were worth. In 2013, that share was 19 percent of families in debt, and they owed, on average, $45,000 more than their homes were worth. The share of families in debt that had outstanding student debt rose from 56 percent in 2007 to 64 percent in 2013, and the average amount of their loan balances increased from $29,000 to $41,000.

And there – as we say quarter after quarter- is your “recovery”: the wealthy have never been wealthier, while half of America, some 50% of households, own just 1% of the country’s wealth, down from 3% in 1989. And finally, America’s poor have never been more in debt.
![]()
Zero Hedge’s mission is to widen the scope of financial, economic and political information available to the professional investing public, to skeptically examine and, where necessary, attack the flaccid institution that financial journalism has become, to liberate oppressed knowledge, to provide analysis uninhibited by political constraint and to facilitate information’s unending quest for freedom. Visit https://www.zerohedge.com