
Morgan Stanley’s Top 10 Surprises For 2021
While we all could use a year without surprises, it would be a surprise itself if we didn’t get any in 2021. As such, Morgan Stanley’s chief rates strategist Matthew Hornbach discusses 10 scenarios which “would surprise consensus and thus could move global macro markets in meaningful ways.”
Below we summarize the 10 surprises and add some details on a select handful afterwards:
-
Surprise #1: DM liquidity avoids EM and drives a DM asset bubble: Liquidity is supposed to overflow the borders of the DM countries that are providing it. But disappointing vaccine take-up and a tough winter in the Southern Hemisphere focus investor attention on DMs with better underlying fundamentals. As liquidity is confined to DMs, valuations and prices squeeze higher. And as DM returns mount, fear of missing out creates the most buoyant DM asset price bubble of all time.
-
Surprise #2: A divided government agrees on an infrastructure package: While a Democrat-controlled Senate would be a surprise, a bigger surprise in 2021 could be a bipartisan agreement on an infrastructure plan. The Fed acknowledges the upside and tapers QE earlier. 10y yields get close to 2%.
-
Surprise #3: ECB strategy review advises greater housing weight in HICP: If the ECB offers an opinion at the conclusion of the strategy review that HICP needs to have a much more representative housing component, and quickly, it may cause the market to start wondering if the next deposit rate move might just be that long-awaited hike.
-
Surprise #4: BoJ rate cut once again on the table: If momentum toward the 2% stability target fails to appear even after vaccination relief from COVID-19, the BoJ may consider a further easing measure to boost price momentum. With Japan short-term real yields remaining high compared to other regions, the BoJ can cut the negative rate further.
-
Surprise #5: EUR/USD positive correlation with equities reverses: The positive correlation between EUR/USD and equities has strengthened in the past year, and it would come as a surprise if the correlation flips. EUR becoming a funding currency could catalyze this scenario.
-
Surprise #6: Immigration causes the northern lights to shine brightest: Canadian growth could meaningfully outperform versus dour market expectations driven by pent-up migration flows, raising the attractiveness of Canadian assets to foreign investors. This would be a CAD-positive surprise for a market that remains bearish on the Canadian outlook.
-
Surprise #7: Long CNH/JPY is derailed by JPY becoming an asset currency: JPY may turn from a funding currency to an asset currency amid the global risk recovery supported by overseas flows, since Japanese stocks appear to be cheap from a valuation perspective. The surprise for CNY could be on both sides. Strong exports could push USD/CNY to reach 6.0, with a nod from the PBOC, while it could reach 7.0 should China’s double tightening reverse investors’ bullish view and US-China tension flare up again.
-
Surprise #8: UK RPI legal challenges result in compensation: Our UK economics team anticipates that the November decision to not offer compensation post-RPI/CPIH alignment will face legal challenges. If those challenges appear as if they might be successful, it may surprise the market to some extent in 2021 and potentially lead to some widening of longer maturity breakevens and/or a steepening of the 10s30s UK inflation curve.
-
Surprise #9: LIBOR-OIS dips negative: In a perfect storm of T-bills richening to ~0bp (or even slightly negative), EFFR remaining at roughly 8-9bp (or only slightly lower), and the TED spread (3m Libor-3m T-bill) compressing to new all-time lows (currently 8.5bp), LIBOR-OIS could briefly dip into negative territory.
-
Surprise #10: “Japanification” of US interest rate volatility: It is possible that increased reliance on central bank guidance and steady central bank purchases could lead to Japanification, or a large compression, of US interest rate volatility. A breakdown of the historically positive relationship between term premiums and implied vol could lead to outperformance of gamma-selling strategies.
Next, we take a closer look at surprises #1, #3 and #9, as described by Morgan Stanley’s Matthew Hornbach.
Surprise #1: DM liquidity avoids EM and drives a DM asset bubble
Lack of vaccine take-up discourages DM liquidity from helping EM markets, blowing up a DM bubble
The liquidity deluge we have written so much about, mostly provided by central banks in Developed Markets (DM), is supposed to make its way around all markets in 2021, both DM and Emerging Markets (EM) alike. This liquidity is supposed to overflow the borders of the DM countries that are providing it, in part because DMs don’t offer enough yield.
But what if vaccine take-up disappoints around the world? In mid-2021, as summer turns to winter in the Southern Hemisphere, virus cases mount. As a result, investors focus more risk-taking in Northern Hemisphere DMs with better underlying fundamentals. As liquidity is increasingly confined to DMs, valuations and prices squeeze higher. And as DM returns mount, fear of missing out creates the most buoyant DM asset price bubble of all time.
Benjamin Franklin is known to have written a letter in French to the scientist Jean-Baptiste Leroy that, “Our new Constitution is now established, everything seems to promise it will be durable; but, in this world, nothing is certain except death and taxes.” He should have added, “and surprises to year-ahead outlooks”. We know there will be surprises to the consensus 2021 outlook, and this document is our attempt get you thinking about what they might be.
Forecasts for markets and economies are set up, in a sense, for failure. Individual forecasts are delivered usually as point forecasts, which provide a false sense of certainty about an uncertain future. The “consensus” exacerbates this problem. It summarizes those disparate, individual forecasts into one proclamation about how the future will unfold. Naturally, the wisdom of this consensus is often ridiculed. However, dismissing the consensus as likely to be wrong misses an important feature of that failure: forecasts can be wrong in direction or magnitude. While getting the direction right is critical, we think the magnitude of moves in 2021 may surprise the most. Our first Top 10 surprise of 2021 starts with something we don’t think will surprise at all: a tremendous amount of central bank quantitative easing (QE).
As we discussed in our year-ahead outlook, Back to Life, Back to Liquidity, very few central banks will be raising policy rates in 2021, and a few will be cutting them further. The main feature of monetary policies will be even larger balance sheet sizes.
From the beginning of the pandemic through 2022, our economists expect G4 central bank balance sheets to increase $12.8 trillion, or 29% of nominal GDP (see Exhibit 1). This degree of balance sheet expansion – occurring over a 3-year period – is akin to the size of expansion that occurred over the 10 years prior. We’ve never seen this degree of expansion over such a short time period.
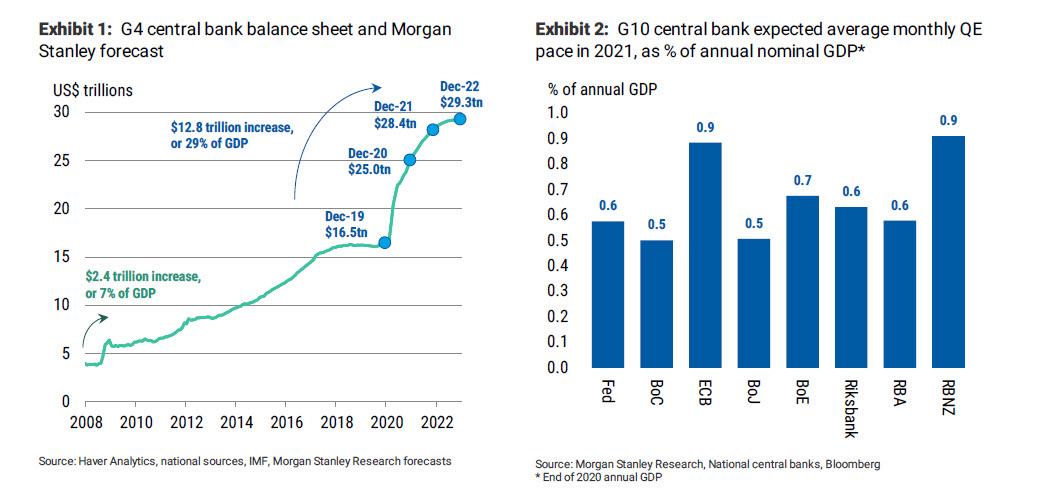
Expanding to the G10, we expect 8 of the G10 central banks to remove a combined US$304 billion of securities ($238 billion of which will be government bonds), on average, from private markets every month in 2021. Unsurprisingly, the Fed and the ECB will remove the most securities each month, in US dollar terms. On the basis of nominal GDP (as of end-2020), the expected ECB and RBNZ purchases in 2021 stand out for their large size (see Exhibit 2). In total, these 8 central banks will be adding liquidity worth 0.66% of annual nominal GDP, on average, every month in 2021. That is a rapid pace of global liquidity injection, the likes of which we haven’t seen outside of 2020.
So where will all of this liquidity end up? Our assumption, and the assumption we think is built into the consensus view, is that it spreads around a variety of markets – both DM and EM – that offer the most attractive yields. But we also know that liquidity doesn’t have to find its way around markets if it doesn’t have an incentive. And it certainly doesn’t have to find its way into the riskiest assets.
The surprise starts with the vaccine…
Markets have been largely immunized from the worsening global COVID-19 infection rates due to (1) the extraordinary amount of liquidity discussed above, and (2) the development of several effective vaccines. We see liquidity support as ongoing, but what if vaccines don’t return us to life as we once knew it?
One reason to not be complacent is the risk around vaccine uptake within the population. If the world’s major economies fail to reach herd immunity on the timelines currently assumed, due to low take-up of the vaccine, then the global economy could fail to hit the lofty growth rates our Global Economics team is expecting.
Exhibit 3 and Exhibit 4 below show data from an IPSOS survey of more than 18,000 adults from 15 countries, in which respondents were asked if they agreed with the statement: “If a vaccine for COVID-19 were available, I would get it”. Of the total sample, 73% agreed with that statement in the October survey, but this was down 4pts from August and the results vary significantly across countries.

In the US, the CDC Advisory Committee on Immunization Practices noted that the overall acceptability of a COVID-19 vaccine was moderate, with 42-86% intending to receive the vaccine (depending on the survey). A large national survey evaluating people’s intention to take the vaccine declined from 72% in May to 51% in September.
The World Health Organization describes vaccine acceptance as “the next hurdle” in the fight against COVID-19 and lists the “enabling environment; social influences; and motivation” as three key drivers of vaccines uptake. The WHO further states that “Low levels of vaccine acceptance can follow from low confidence in vaccines, as a result of, for example, the belief that the vaccine will not be effective”, affecting motivation. The good news here is that the Pfizer and Moderna vaccines have been found to be highly effective, which should encourage uptake. However, there has been some uncertainty about the efficacy the Astra Zeneca vaccine, which is the vaccine that many less developed economies could rely on given its less demanding transportation requirements.
This risk could make the outlook for EMs more challenging. Some EMs have been spared the same surge in infection rates seen in Europe and the US, perhaps in part due to the seasons. As winter ends in the Northern Hemisphere, Morgan Stanley expects infection rates to drop. But for EMs in the Southern Hemisphere, the opposite may be the case.
…and ends with a redirection of liquidity
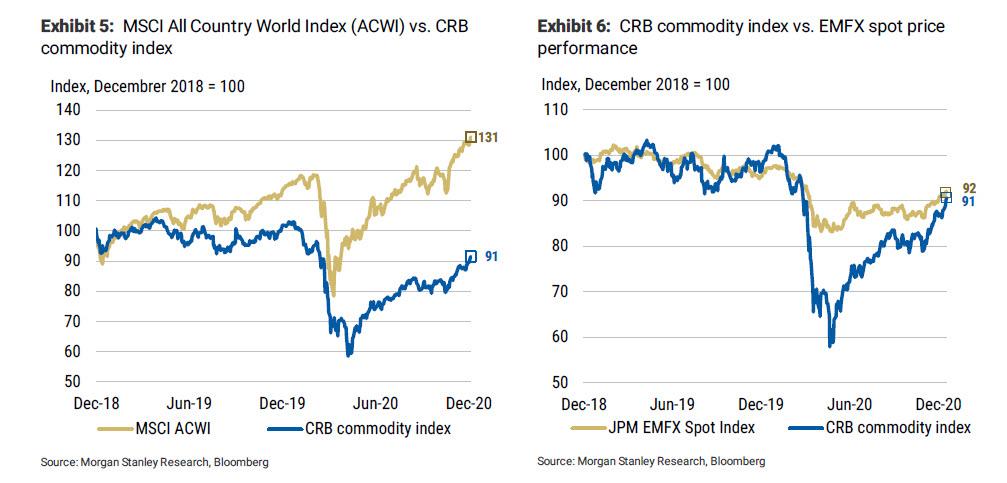
The impact of a renewed surge in infections on EM asset prices could be neutralized to some extent by ample central bank liquidity. But what if the liquidity is directed elsewhere? We know that liquidity had a dramatic impact on equity and, to a lesser extent, on commodity prices throughout the year (see Exhibit 5). But we also know that it had much less impact on EMFX markets, which generally track ommodity prices well (see Exhibit 6).
In this surprise, investor enthusiasm for EM fades and the liquidity generated by DM central banks remains in DM. As investors deploy this liquidity, DM valuations and prices squeeze higher. This would prevent bond yields from rising as much as we, or consensus, expect. In addition, it would boost risky-asset prices above already elevated consensus projections.
While US Treasury yields remain unattractive from a historical perspective, they are the highest in DM. As such, Treasuries benefit from this DM liquidity, and the consensus forecast for 10y yields at the end of 2021 (1.25%) is disappointed by the 10y yield remaining below 1.00%. This allows broad liquidity, in addition to the narrow liquidity injected by central banks, to remain ample, which boosts the prices of risky assets.
As risky-asset prices in DM rise above consensus forecasts (median S&P 500 forecast at 4,000, according to Bloomberg), fear of missing out drives prices even higher. In the rally, even the most optimistic forecasts for year-end are surpassed mid-year (high S&P 500 forecast at 4,400, according to Bloomberg). With no end in sight, news outlets label 2021 the year of “the greatest asset bubble of all time”.
* * * * *
Surprise #3: ECB strategy review advises greater housing weight in HICP
Housing weight to eventually climb in HICP?
Rather than changing, increasing or decreasing the inflation target while adhering to a commitment to symmetry, the ECB could suggest at the conclusion of the strategy review that Eurostat/Member State statistical agencies should design a HICP measure that lends greater weight to owner-occupied housing costs in the future. Currently, actual rents/owner-occupied housing represent just 6.6% of euro area headline inflation versus over 20% in the UK and over 30% in the US, meaning that euro area inflation significantly understates one of the few areas where there has actually been steady inflation in Europe in recent years.
However, a commitment to a more robust and accurate measure could lead the market to conclude that inflation has a better chance of actually converging towards target during periods of economic growth, resulting in less need for exceptionally accommodative monetary policy in the future.
It has been almost a year since we first published A Review for the Ages in January 2020, but many of the key themes and questions we focused on in relation to the ECB’s strategy review remain as relevant today as they did then.
For example, one conversation that will likely be included as part of the ECB strategy review is whether or not it should consider an alternative to HICP when assessing and defining price stability, given that a number of publications like Thoughts on a Review of the ECB’s Monetary Policy Strategy (Blot, Creel, Hubert) suggest that a sizeable portion of the factors influencing inflation are global in nature and outside the ECB’s control.
In 2021, we think that a possible surprise for the market could be that the ECB strategy review concludes that one of the main issues impacting inflation is a measurement issue in addition to demographics, technology, globalization and a lack of fiscal support (until recently) to complement easy monetary policy following the GFC and sovereign crisis periods.
Simply put, low/negative rates and the ECB’s exceptionally accommodative stance have had an impact on inflation across the euro area – but it just so happens that one of the key places where that inflation has been the most pronounced is barely represented in HICP.
At the start of 2020, it appeared that the ECB may have been considering giving more attention to housing-related inflation, given the increasingly larger number of references to owner-occupied housing costs from ECB Governing Council members and within the January and February 2020 Accounts of the monetary policy meetings.
- From the January 2020 Account of the monetary policy meeting, “moreover, as HICP inflation only partially reflected changes in housing-related costs inflation measures would likely be higher currently if the cost of owner-occupied housing was accounted for.”
- From the January 2020 Account of the monetary policy meeting, “regarding the impact of the cost of owner-occupied housing on inflation measures it was pointed out that while the effect of including this factor was generally procyclical and increased the volatility of inflation, it could also help to explain the perception of higher inflation in some countries where housing market developments had been relatively strong.”
- From the February 2020 Account of the monetary policy meeting, “HICP inflation excluding food and energy was at its highest level for four years, although it was still slightly below its pre-crisis average. It was remarked that this level had been reached even without housing costs fully represented in the inflation measures.”
However, those references disappeared as quickly as they started once the strategy review was delayed and the pandemic response became the principal area of focus for the ECB. In fact, since the February 2020 Account of the monetary policy meeting, there have been next to no references to owner-occupied/rental/housing inflation anywhere within the ECB Accounts of the monetary policy meetings. But in 2021, the strategy review may finally have a chance to be completed.
HICP significantly understates housing inflation: One of the more common critiques of HICP as a broader measure of inflation in the euro area is that it significantly understates the true cost of housing and rental inflation, both of which tend to respond pro-cyclically during periods of growth that occur simultaneous with accommodative monetary policy.
Currently, ‘actual rents’ in HICP account for only 6.6% of the index whereas more modelbased owners’ equivalent measures in indices like UK CPIH, Canada CPI and the US CPI are comfortably more than 20% of the overall inflation measure (see Exhibit 12).
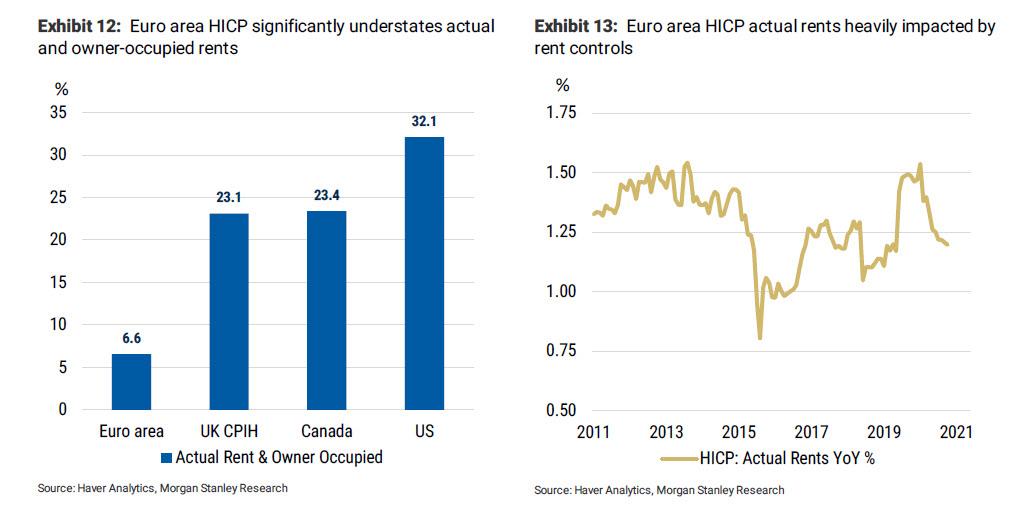
While a portion of this under-representation is due to issues with the construction of the index and furthermore what types of observable prices are allowed to be included, the problem runs even deeper when accounting for the fact that a significant portion of the 6.6% ‘actual rents’ inflation is subject to rental controls.
ECB Economic Bulletin Issue 8/2016 highlights this problem by noting that, “in some euro area countries rent controls, including indexation, are important and can lead to a longer-lasting divergence between the two sets of prices. This is especially true of social housing, which accounts for a significant part of some countries’ national HICP ‘actual rentals for housing’ component.”
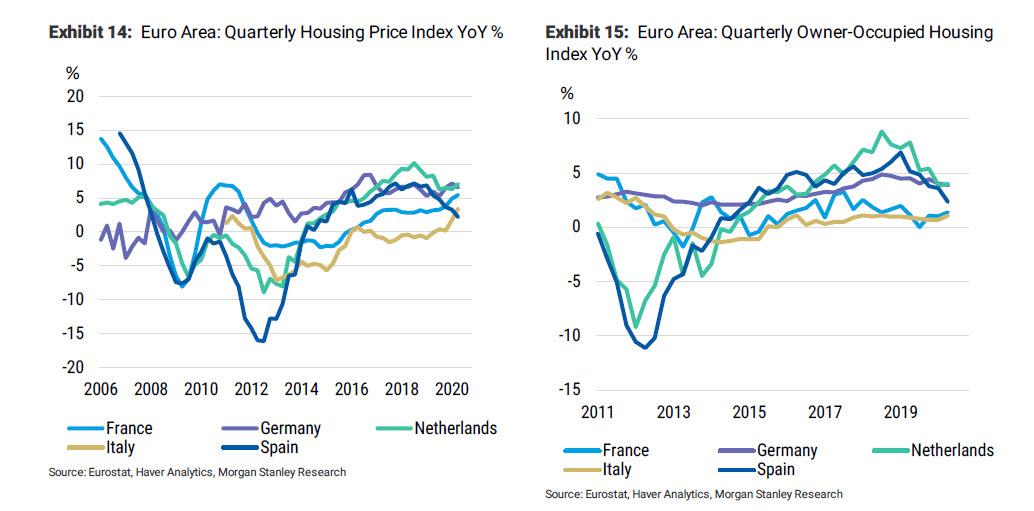
House prices have been rising in the euro area: Currently, there are two different quarterly series published in the euro area by Eurostat/Member State statistics offices that measure house price and/or owner-occupied housing inflation. Eurostat has published a Technical manual on Owner-Occupied Housing and House Price Indices in 2017, which describes their methodology.
Both series (see Exhibit 14 and Exhibit 15) show that there has been some degree of appreciation in house prices in recent years across each of the largest euro area Member States, suggesting that inflation may have been marginally higher during these periods of economic growth/low rates if there was greater housing inclusion in HICP.
ECB President Lagarde appeared to agree with this sentiment in a May 2020 letter, where she noted that, “It is also important to note that, according to experimental calculations, adjusted inflation figures giving a larger weight to housing costs are currently slightly higher than the annual HICP inflation rate, whereas at some points in the past such adjustments would have resulted in a lower inflation rate.”
Yet significant challenges remain: On the surface, advising Eurostat/Member State statistics agencies to create a series that lent more weight to housing-related inflation measures would seem to be a quick fix to address some of the known measurement issues facing HICP.
However, the process of doing so is anything but simple, which is why any suggestion that it be fast-tracked could come as a surprise to the market. Consider the following:
- HICP includes observable prices in its methodology but greater housing inclusion would require the potential introduction of more model-based series.
- Both of the current house price/owner-occupied series are quarterly indices while HICP is a monthly series that is reported non-seasonally adjusted. Before the process of including housing on a larger scale could begin, the series would need to be reported monthly, potentially leaving them susceptible to large swings.
- Finally, there are currently no quarterly dwelling price/owner-occupied series for Greece.
In other words, there remains a lot of debate about both how a more-housing inclusive HICP series could be created and the speed at which that series creation could occur. These issues were summed up best by the following two quotes from ECB President Lagarde:
- December 2, 2019, ECB Press Conference Q&A.“The whole debate of whether or not we take housing into the measurements and what portion of housing and how do we dissect between the asset value of the land and the actual use of the premises. Those are tricky technical questions that we will have to look at, and on which we should also take a view because there is…quite a difference between the various perceptions, anticipation, expected inflation depending on how we measure it.”
- President Lagarde in a May 2020 letter, “ultimately, it is Eurostat and the statistical offices of the EU Member States that decide how owner-occupied housing may best be treated in the HICP context. The ECB will contribute with its opinion at the end of the strategy review.”
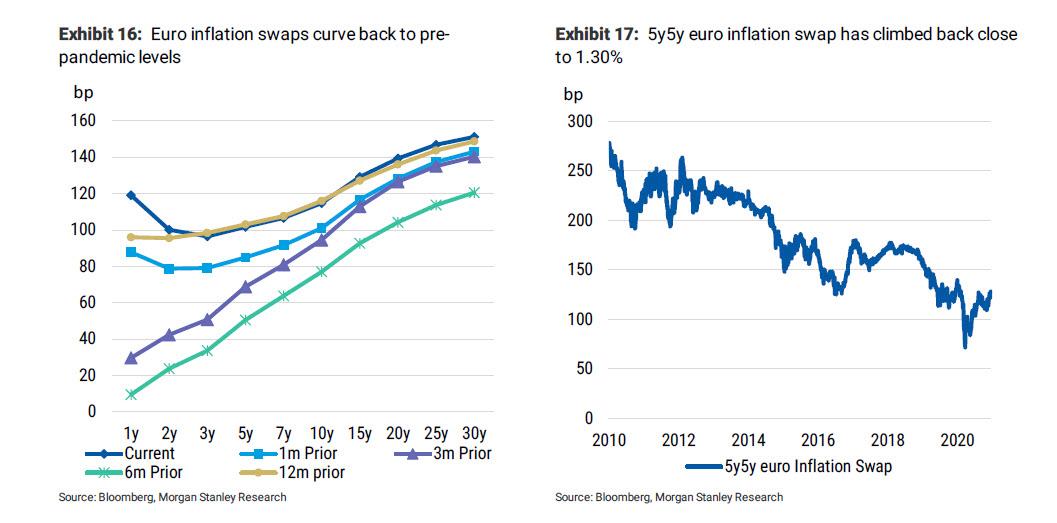
Financial markets are already starting to price some inflation: In recent weeks, market-based measures of inflation expectations have been climbing higher in the euro area, suggesting that financial market participants may be starting to envision a potential return of inflation in the coming years despite the fact that year-on-year measures of HICP remain incredibly low.
At the time of our writing, the price of Brent in euros had risen to its strongest level since March while the 5y5y euro inflation swap had climbed back to its highest level since February 2020. And, in recent days, input and output price indices in the broader euro area manufacturing PMI have also continued to accelerate higher, suggesting the possibility that some inflationary pressures are building underneath the surface.
Measures of year-on-year inflation are already expected to rise in 2021 given the presence of very favorable base effects, but current ECB deposit rate cut pricing does not yet seem to reflect an environment where that rise in inflation could result in a change to the ECB forward guidance, particularly if the euro keeps appreciating.
However, if the ECB offer an opinion at the conclusion of the strategy review that HICP needs to have a much more representative housing component, and quickly, it may just cause the market to start wondering if the next deposit rate move might just be that long-awaited hike.
* * * * *
Surprise #9: LIBOR-OIS dips negative
A perfect storm could result in negative LIBOR-OIS
If a two key events occur simultaneously, LIBOR-OIS could briefly dip into negative territory. First, T-bill-OIS would need to widen to -6bp to -8bp, which essentially means that T-bills trade near or at 0bp (or dip briefly into negative territory), while EFFR (and OIS) remains stable at 8-9bp (or richens only 1-2bp). While we think T-bills will richen with significant paydowns next year, it is less clear that T-bill-OIS will widen by that much, as EFFR would likely also move lower.
Second, the TED spread, as measured by 3mL – 3m T-bill, needs to continue to compress toward all-time lows of 8.5bp. Under this “perfect storm” of events LIBOR-OIS could feasibly trade negative; however, even then, it would likely not persist in negative territory. Should this happen, we also think front-end spreads would also trade negative.
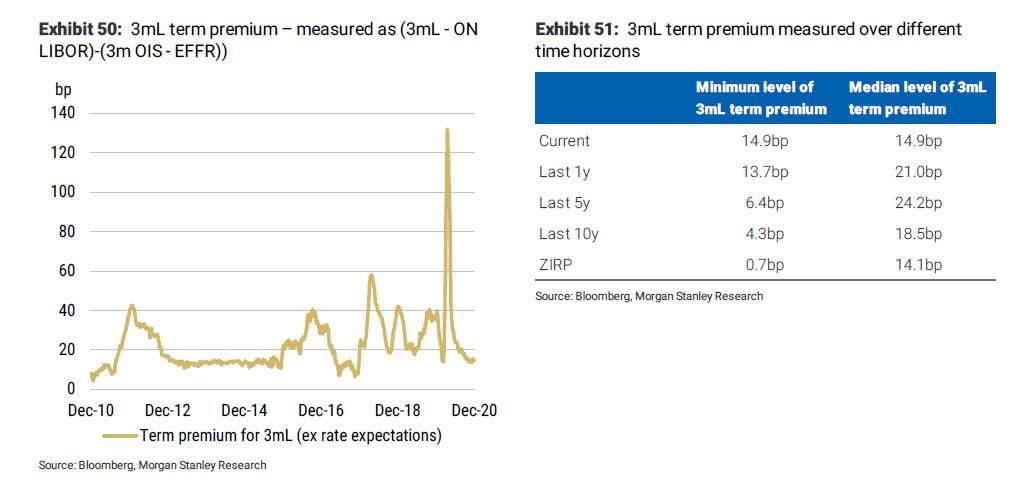
With rate expectations in the front end essentially flat and fixed, the term premium of 3mL has been driving the rate. Over the last few months, term premium of 3mL has compressed substantially (see Exhibit 50). In fact, the current level of 3mL term premium (over ON LIBOR) is below the median for the last 1, 5 and 10 years (see Exhibit 51).
However, we think there is room for the term premium to compress even further, in a perfect storm of conditions. Though the current level of term premium is lower than the medians over the last 1, 5 and 10 years, it is actually still above the minimum value seen in the those time periods. Perhaps even more notable, it is well above the minimum level seen in any ZIRP regime (14.9bp versus 0.7bp).
LIBOR-OIS can be deconstructed into (3m T-bill – OIS) + (3m LIBOR – 3m T-bill). We will refer to the latter term as the TED spread. As such, as we first noted in Negative LIBOR-OIS Ahead?, in order for LIBOR-OIS to go into negative territory, two key things need to happen:
- 3m T-bill-OIS widens significantly, to at least -6bp to -8bp: It would be difficult for 3m T-bill-OIS to widen much beyond that as long as OIS remains in the 8-9bp range, as that implies T-bills move into negative territory. While T-bills can trade negative, it is difficult for them to persist in negative territory given that MMFs and other buyers of T-bills can shift allocations (for example, MMFs could leave cash at the Fed, earning ON RRP). Should EFFR fall below 8-9bp by a decent amount, 3m Tbill- OIS widening to -6bp to -8bp is increasingly unlikely.
- Compression of the 3m TED spread to or near all-time lows: This spread generally reflects the attractiveness of government versus prime MMFs. We suggested in In an Emergency, Break Glass that this spread would likely never go below 6bp, as that is, on average, the difference between institutional prime MMF and institutional gov MMF expense ratios. Since that piece, the difference between expense ratios has narrowed, perhaps even reducing the floor of the TED spread further. If you then consider the other characteristics that make a prime MMF less attractive, such as redemption fees and liquidity fees, it seems reasonable that the lower bound on the TED spread could be even a few bp higher, perhaps reaching 8bp. If the spread were to compress below 6-8bp, you would likely see a large rotation out of prime funds and into government funds, reducing prime AUM and therefore CP demand (as well as increasing gov AUM and therefore T-bill demand). Hence, the spread would widen further. Indeed, since MMF reform, the lowest this has gone in the last five years is 8.5bp.
So, what could lead to these two events?
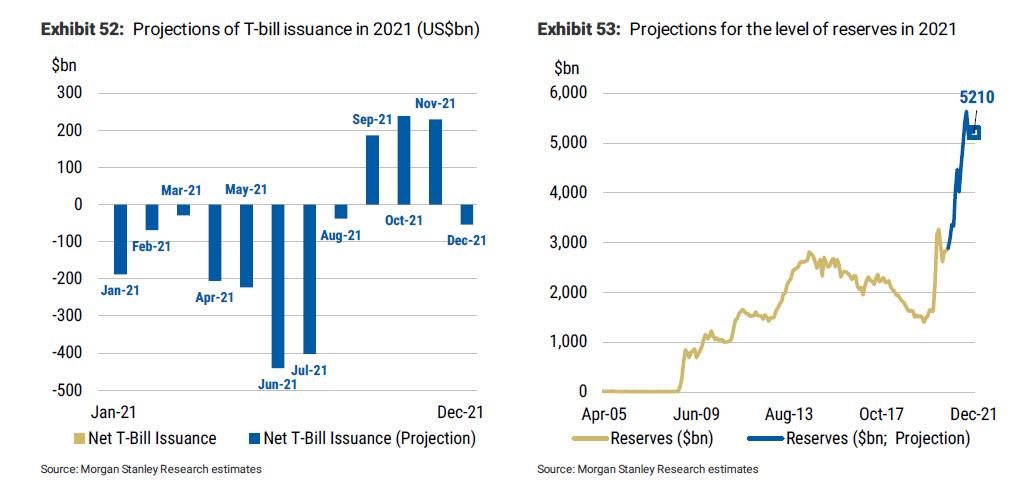
Let’s begin with event # 1, the extreme richening of T-bills. Currently, 3m T-bills are trading roughly in line with 3m OIS. In 2021, however, we expect significant T-bill paydowns. Even with US$1 trillion of stimulus baked into issuance forecasts, we project ~US$1 trillion of T-bill paydowns (see Exhibit 52). Paydowns will be the most extreme in size leading into the August 1, 2021 debt-ceiling deadline, as the Treasury has to draw the TGA down to ~US$200 billion by the deadline.
As such, we expect that a reduction in supply could lead to a sharp richening of T-bills. Furthermore, we expect demand for T-bills to increase in 2021. With continued Fed purchases of US$120 billion/month (US$80 billion UST and US$40 billion MBS), reserves will continue to grow. Furthermore, a reduction in the TGA to ~US$800 billion by end-2021 (and even lower at certain points in the year) would only lead to a larger increase in reserves (see Exhibit 53). In fact, we expect reserves to end 2021 over US$5 trillion. So, our base case is that T-bills are very likely to richen.
So perhaps the larger “surprise” would occur if the TED spread compressed enough such that LIBOR-OIS dipped into negative territory. In the 2021 Outlook, we wrote that our base case is for LIBOR-OIS to trade relatively range-bound in the low- to mid-teens in 2021, with risks toward both widening and tightening. This implies that our base case for the TED spread is modest widening (to offset richening of T-bills, resulting in a stable LIBOR-OIS).
However, we can envision a scenario in which the TED spread compresses alongside Tbill richening. On the demand side, while we expect reserves to increase (some of which will presumably end up in MMFs), we expect cash to flow into both gov MMFs and prime MMFs, so this shouldn’t be a differentiating factor for the TED spread. In fact, if anything, it seems more likely that more cash would go into gov MMFs, further widening the TED spread. So, it could come as a surprise – though it is not entirely out of the question – that inflows are stronger to prime MMFs than gov MMFs, leading to potential tightening of the TED spread.
On the supply side, though, it is possible that supply shrinks substantially, driving the TED spread tighter. In a recent Senior Financial Officer Survey (discussed more in depth in Clash of the Titans), 30 domestic banks and two foreign banks stated that they would intentionally allow outstanding term funding (i.e., CP and CDs) to mature without renewing these sources of funding in order to reduce their own level of reserves.

While this would undoubtedly lead to a reduction in overall CP if actualized, the question remains what would the effect be? Financial CP markets are dominated by foreign, not domestic, issuance. So, if domestic banks are the only ones to reduce issuance, it may not have a huge impact on the margin. However, if foreign banks follow suit, and all financial CP supply falls, that could be the catalyst for TED spread tightening.
On the whole, while not our base case, we would not be entirely surprised to see LIBOR-OIS tighten enough that it dips into negative territory briefly. We think this would come as a surprise to the broader market consensus. In order for this to occur, 3m Tbills would need to trade near or at 0bp (or potentially even dip into negative territory), simultaneous with an extreme compression in the LIBOR term premium and TED spread near or at all-time lows (which is 8.5bp). And EFFR (and OIS) mustn’t fall below 8-9bp, as that would constrain the amount that T-bill-OIS can widen to. In the event that LIBOR-OIS goes negative, front-end swap spreads will also likely trade negative. In fact, that could preempt a move of LIBOR-OIS into negative territory.
Lastly, we find it worth mentioning that should LIBOR-OIS trade negative, it would not be likely to persist.
Tyler Durden
Thu, 12/31/2020 – 06:20![]()
Zero Hedge’s mission is to widen the scope of financial, economic and political information available to the professional investing public, to skeptically examine and, where necessary, attack the flaccid institution that financial journalism has become, to liberate oppressed knowledge, to provide analysis uninhibited by political constraint and to facilitate information’s unending quest for freedom. Visit https://www.zerohedge.com