Real-Time Card Spending Data Shows The Next Stimulus-Funded Buying Spree Has Arrived
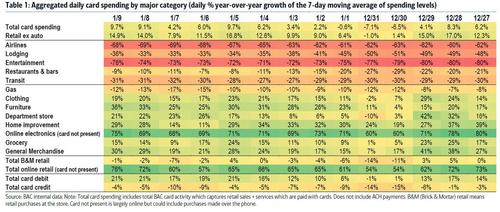
The latest real-time data from BofA credit and debit card usage showed a marked turnaround in spending from the December slump – according to BofA economist Michelle Meyer, total card spending was up 9.7% YOY for the 7-days ending Jan 9th, owing in large part to the $900bn COVID-relief stimulus passed at year-end. This is up from -0.6% just 9 days earlier, and confirmed that the latest government-funded spending spree has arrived.
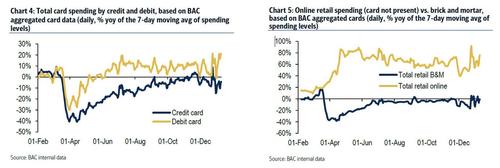
The surge in post-holiday spending thanks to the $900BN stimulus can be seen on both a total card and ex-auto basis in the two charts below:
As before, the bulk of the excess spending was funded by debit card, which is where government stimulus funds were deposited. And, as before, most spending took place online which was about 80% higher compared to a year ago while traditional retail spending was flat to slightly down Y/Y.
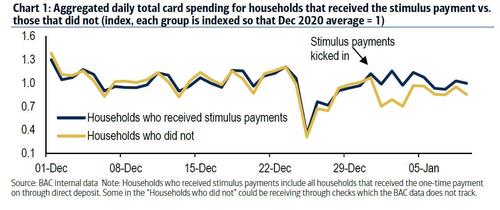
According to the Treasury, $112bn of “Economic Impact Payments” were distributed through direct deposit in the first week of the year. Using BAC aggregated direct deposit data, one can isolate the cohort of households who received the payment and track aggregated spending for this population versus the rest of the sample to gauge the impact of the stimulus. This is the same exercise we showed following the April CARES stimulus.
Here are the main points:
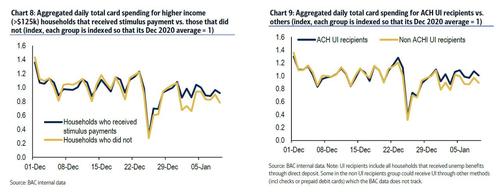
- Total card spending for the stimulus recipients accelerated meaningfully at the start of the year with a jolt on Jan 1st which lasted about 5 days. Total card spending for stimulus recipients is up nearly 20% yoy average since Jan 1, which is almost 4X the Dec average growth rate. This compares to those without stimulus payments where spending was flat on a YOY basis since Jan 1. We can also show the differential using indexed values – over the five days starting Jan 1st, total card spending for stimulus recipients was 30% above the rest of the population (Chart 1).
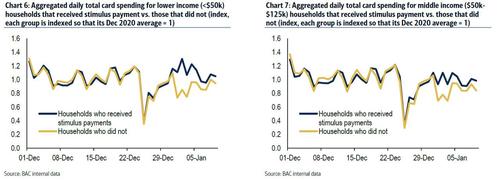
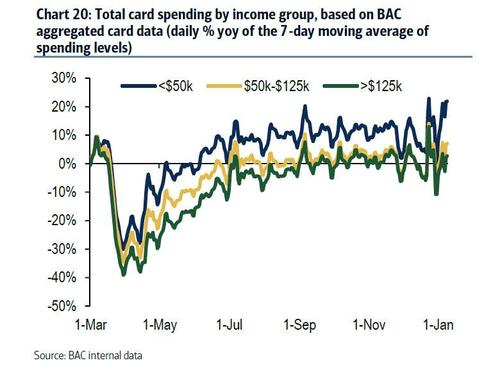
- Lower income households saw a bigger boost from the stimulus with spending for stimulus recipients reaching nearly 40% above those without. The differential for the highest income tier was a more modest 20%
- Indeed, total card spending for the lowest income tier is running at a stellar 22% YOY for the 7-days ending Jan 9th.
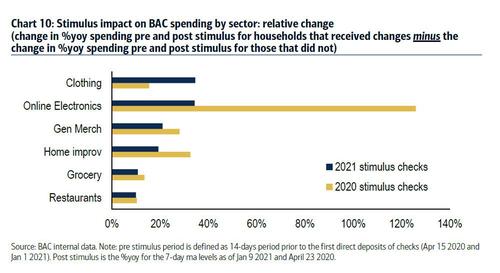
- Stimulus funds provided the biggest boost to clothing, followed by online electronics, general merchandise, and home improvements. In April, stimulus funds disproportionately went to online electronics, suggesting there may have been some saturation in electronics demand. This is shown in the next chart which compares the change in the YOY growth rates pre (Dec avg) and post (7 days ending on Jan 9) stimulus for the recipients vs. those without the payments.
- Expanded unemployment insurance (UI) also helped on the margin with total card spending for UI recipients accelerating modestly relative to non-UI recipients.
Bottom line: lower income households, who have the highest propensity to spend any “unexpected” financial windfall, are doing just that, which means that retail sales in January will be off the charts. The only question – for market participants – is how much of this latest stimulus, or the coming $1.9 trillion one for that matter, will enter the market?
Tyler Durden
Fri, 01/15/2021 – 07:11![]()
Zero Hedge’s mission is to widen the scope of financial, economic and political information available to the professional investing public, to skeptically examine and, where necessary, attack the flaccid institution that financial journalism has become, to liberate oppressed knowledge, to provide analysis uninhibited by political constraint and to facilitate information’s unending quest for freedom. Visit https://www.zerohedge.com
