2009-2010 Playbook Says Pullback Coming
Submitted by Nick Colas of DataTrek Research
What 2010 can tell us about 2021?
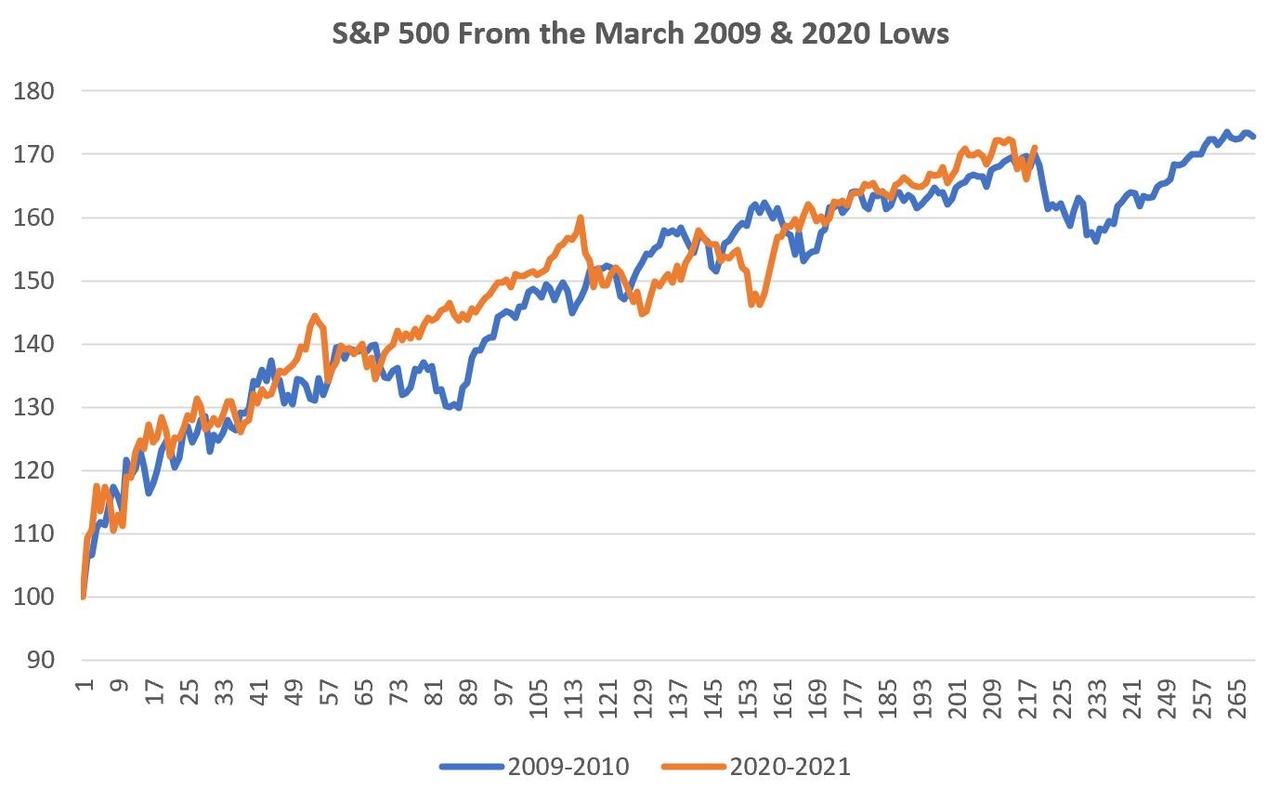
After the Pandemic Crisis lows last March, we routinely reviewed what we called the “2009 Playbook”. This compared the S&P 500’s performance after the March 9th, 2009 lows to its move higher after the March 23rd, 2020 lows.
This approach worked well, as the chart below highlights. When 2020 (orange line) ran out ahead of the 2009 experience (blue line), it invariably pulled back. And when 2020 occasionally lost some of its courage, it wasn’t long before it found it once again and returned to the 2010 pathway.
Usefully, the 2009 playbook is still working even as we go deeper into 2021. As of yesterday’s close, which was 219 trading days after the lows, the S&P 500 is 71 percent off the March 23rd, 2020 closing level. On Day 219 after the March 9th, 2009 lows, the S&P was up 70 percent. Yes, we know. It’s creepy…
The chart below is flashing a warning sign just now, so let’s talk about it:
-
The 2009 – 2010 line shows that the S&P 500 started a move lower at this point in its post-Financial Crisis recovery.
-
This was a pretty textbook “correction”, which took 13 trading days and took 8.2 percent off the index.
-
The S&P then recovered over the following 30 trading days and ended March 2010 at new highs.
Takeaway: this isn’t so much a trading call as an illustration of what happens as we get deeper into a cyclical recovery. The chart shows 2020 diverged from the 2009 path several times, and 2021 might well do the same. But with so many market observers looking for a trading pullback, what we’re now calling the “2009 – 2010 Playbook” offers productive guidance on what to expect and where to start buying.
Tyler Durden
Fri, 02/05/2021 – 06:10![]()
Zero Hedge’s mission is to widen the scope of financial, economic and political information available to the professional investing public, to skeptically examine and, where necessary, attack the flaccid institution that financial journalism has become, to liberate oppressed knowledge, to provide analysis uninhibited by political constraint and to facilitate information’s unending quest for freedom. Visit https://www.zerohedge.com