
[This article is part of the Understanding Money Mechanics series, by Robert P. Murphy. The series will be published as a book in 2021.]
The “yield curve” refers to a graph showing the relationship between the maturity length of bonds—such as one month, three months, one year, five years, twenty years, etc.—plotted on the x axis, and the yield (or interest rate) plotted on the y axis.1 In the postwar era, a “normal” yield curve has been upward sloping, meaning that investors typically receive a higher rate of return if they are willing to put their funds into longer-dated bonds. A so-called inverted yield curve occurs when this typical relationship flips, and short-dated bonds have a higher rate of return than long-dated ones.
Investors and financial analysts are very interested in this phenomenon, because an inverted yield curve (defined in a particular way) has been a perfect leading indicator of a recession going back at least fifty years. If we look at the last eight recessions, beginning with the downturn that began in December 1969, an appropriately defined yield curve inversion preceded all of them about a year ahead of time. Moreover, during this same fifty-one-year period the (appropriately defined) yield curve has only inverted when there would soon be a recession. (See the endnotes for citations to the scholarly literature.2) The following chart illustrates the yield curve’s apparent predictive power:

In the above chart (which only goes back to the early 1980s and so doesn’t cover the full extent of the yield curve’s successful track record), we have charted the difference (or “spread”) between the implicit interest rate on ten-year Treasury bonds and three-month Treasury bills. The normal state of affairs is for the yield on the longer ten-year security to be higher than the yield on the very short three-month security. (That’s why the line in the chart is typically above the black horizontal line at the 0 percent notch.)
However, every once in a while the yield curve inverts, meaning that the line in the chart dips below the 0 percent threshold, corresponding to a situation in which the yield on three-month T-bills is actually higher than the yield on ten-year Treasury bonds. Notice in our chart that whenever that happens—and only when that happens—the economy soon goes into a recession (indicated by the gray bars).
Economists have tried to explain the mechanism by which an inverted yield curve signals an impending recession. As we will see, the conventional attempts—such as the one offered by Paul Krugman—do not fit the actual facts. In contrast, the Misesian explanation of the business cycle quite easily explains the pattern we observe in interest rates during the “normal” boom time and shortly before the bust.
Paul Krugman on the Inverted Yield Curve
In his New York Times column and associated blogging platform, Paul Krugman over the years has clearly singled out investor expectations as the driving force behind the historical pattern. Here is Krugman in late 2008:
The reason for the historical relationship between the slope of the yield curve and the economy’s performance is that the long-term rate is, in effect, a prediction of future short-term rates. If investors expect the economy to contract, they also expect the Fed to cut rates, which tends to make the yield curve negatively sloped. If they expect the economy to expand, they expect the Fed to raise rates, making the yield curve positively sloped. (bold added)3
Then, in his column from mid-August of 2019—commenting on the then recent inversion of the two-year and ten-year yields, which was spooking investors—Krugman applied his framework to the data:
An old economists’ joke says that the stock market predicted nine of the last five recessions. Well, an “inverted yield curve”—when interest rates on short-term bonds are higher than on long-term bonds—predicted six of the last six recessions. And a plunge in long-term yields, which are now less than half what they were last fall, has inverted the yield curve once again, with the short-versus-long spread down to roughly where it was in early 2007, on the eve of a disastrous financial crisis and the worst recession since the 1930s.
Neither I nor anyone else is predicting a replay of the 2008 crisis. It’s not even clear whether we’re heading for recession. But the bond market is telling us that the smart money has become very gloomy about the economy’s prospects. Why? The Federal Reserve basically controls short-term rates, but not long-term rates; low long-term yields mean that investors expect a weak economy, which will force the Fed into repeated rate cuts. (bold added)4
As the above quotations make clear, Krugman argues that the yield curve flattens/inverts before a recession because investors forecast trouble ahead. There are two problems with this approach.
First, why would an inverted yield curve spook investors if the reason it inverts is that investors already know a recession is coming?
Second and more significant: Krugman’s explanation would make sense if yield curve inversions typically occurred when the long bond yield collapses. But in fact, as the following chart makes clear, the yield curve inverts primarily because the short rate spikes upward before a recession:

In the above chart, particularly for the middle three recessions, it is clear that the yield curve inverted because the three-month yield (black line) rose rapidly to surpass the ten-year yield (green line). This is the opposite of what Krugman’s readers would have expected to see.
An Austrian Explanation
In contrast to Krugman’s story, standard Austrian business cycle theory—which we explained in chapter 9—is quite compatible with the evidence presented in the above figure. In the Misesian framework, the unsustainable boom is associated with “easy money” and artificially low interest rates. When the banks (led by the central bank, in modern times) change course and tighten, interest rates rise and trigger the inevitable bust.5 (It is standard in macroeconomics to assume that the central bank’s actions affect short-term interest rates much more than long-term interest rates.)
In fact, as Ryan Griggs and the present author have demonstrated, changing growth rates in the Austrian “true money supply” (TMS) monetary aggregate correspond quite well with the spread in the yield curve:
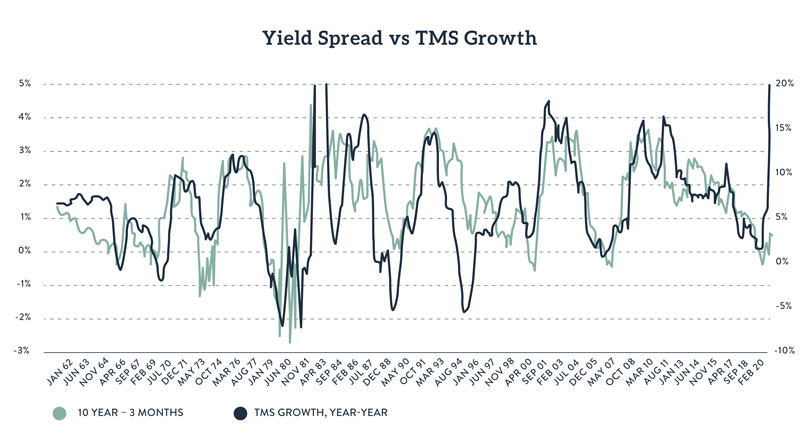
In the above chart, the green line (corresponding to the left axis) is the difference between the ten-year Treasury bond yield and the three-month T-bill yield. The black line (corresponding to the right axis) is the twelve-month percentage growth in the true money supply as defined by Rothbard and Salerno (and which we briefly discussed in chapter 5).
As the chart indicates, these two series have a remarkably tight connection. Specifically, when the money supply grows at a high rate, we are in a “boom” period and the yield curve is “normal,” meaning the yield on long bonds is much higher than on short bonds. But when the banking system contracts and money supply growth decelerates, then the yield curve flattens or even inverts. It is not surprising that when the banks “slam on the brakes” with money creation, the economy soon goes into recession.
In summary, the standard Austrian explanation of the business cycle has, as a natural corollary, a straightforward explanation for the apparent predictive power of an inverted yield curve.
- 1. The material in this chapter draws on a forthcoming QJAE article authored by Ryan Griggs and Robert P. Murphy.
- 2. Perhaps the first systematic exploration of the inverted yield curve’s ability to forecast recessions was Campbell Harvey, “Recovering Expectations of Consumption Growth from an Equilibrium Model of the Term Structure of Interest Rates” (PhD diss., University of Chicago, 1986), https://faculty.fuqua.duke.edu/~charvey/Research/Thesis/Thesis.pdf. For a more recent discussion, see Arturo Estrella and Mary R. Trubin, “The Yield Curve as a Leading Indicator: Some Practical Issues,” New York Fed: Current Issues in Economics and Finance, July/August 2006, pp. 1–7, https://www.newyorkfed.org/medialibrary/media/research/current_issues/ci12-5.pdf.
- 3. See Paul Krugman, “The Yield Curve (Wonkish),” Paul Krugman blogs, New York Times, Dec. 27, 2008, https://krugman.blogs.nytimes.com/2008/12/27/the-yield-curve-wonkish/.
- 4. See Paul Krugman, “From Trump Boom to Trump Gloom,” New York Times, Aug. 15, 2019, https://www.nytimes.com/2019/08/15/opinion/trump-economy.html.
- 5. Paul Cwik’s work explains the inverted yield curve’s predictive power in light of Austrian business cycle theory. See for example Paul Cwik, “The Inverted Yield Curve and the Economic Downturn,” New Perspectives on Political Economy 1, no. 1 (2005): 1–37; and “An Investigation of Inverted Yield Curves and Economic Downturns,” (PhD diss., Auburn University, 2004).
The Mises Institute exists to promote teaching and research in the Austrian school of economics, and individual freedom, honest history, and international peace, in the tradition of Ludwig von Mises and Murray N. Rothbard. These great thinkers developed praxeology, a deductive science of human action based on premises known with certainty to be true, and this is what we teach and advocate. Our scholarly work is founded in Misesian praxeology, and in self-conscious opposition to the mathematical modeling and hypothesis-testing that has created so much confusion in neoclassical economics. Visit https://mises.org