
As Shorts Go Extinct, All Market “Sell Signals” Are Now Completely Useless
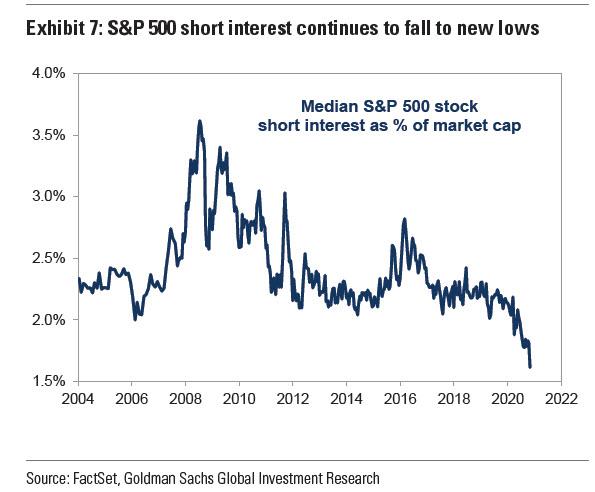
Last November, several months before the reddit targeted squeeze of highly shorted names like GME and AMC arrived, we looked at the latest hedge fund 13F filings and said that “Hedge Funds Go “All-In” As Bears Go Extinct: Shorts Drop To Record Lows“, presenting the following chart from Goldman which showed that short interest in the median S&P500 had collapsed to all time lows.
Incidentally, that’s also when we predicted that those stocks which still had some shorts left are about to suffer major squeeze in the coming weeks:
… since it is the most shorted stocks that end to do far better than the most popular ones, especially during market-wide squeezes such as the one seen since March, here is also the list of 50 most-shorted stocks. As usual, our advice is to go long the most hated names and short the most popular ones – a strategy that has generated alpha without fail for the past 7 years, ever since we first recommended it back in 2013.
Boy, would we be right just two months later…
But anyway, last weekend Bloomberg picked up on this theme, and six months after our eulogy for shorts, reiterated that “Stock Shorts Collapse as No Hedge Fund Wants ‘Head Ripped Off“
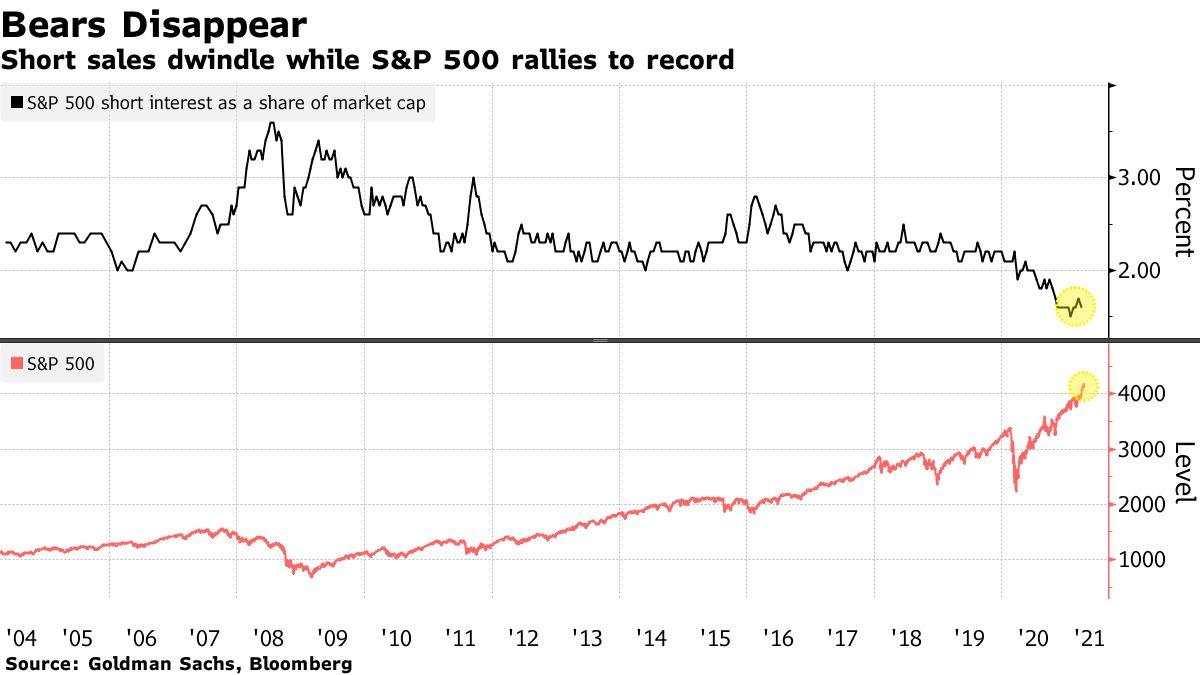
Wall Street bears battered by the Reddit crowd earlier this year have yet to regain their gumption, even with stocks at records and valuations near two-decade highs. The median short interest in members of the S&P 500 sits at just 1.6% of market value, near a 17-year low, according to Goldman Sachs Group Inc. In Europe, a short-covering frenzy has sent bearish bets collapsing like never before in Morgan Stanley data.
They’re all signs of the bullish mania propelling global equities to fresh records this month, thanks to the economic re-opening and big policy stimulus. The smart money has little appetite to wager against either expensive or deadbeat companies — especially after being lashed by the day-trader army earlier this year.
“There’s just mass euphoria,” said Benn Dunn, president of Alpha Theory Advisors. “No one wants to get their head ripped off by a short anymore.”
The chart BBG showed is one we have frequently posted over the years – the only chronicling the demise of all bears in a market that is now a centrally-planned policy tool used primarily by politicians:
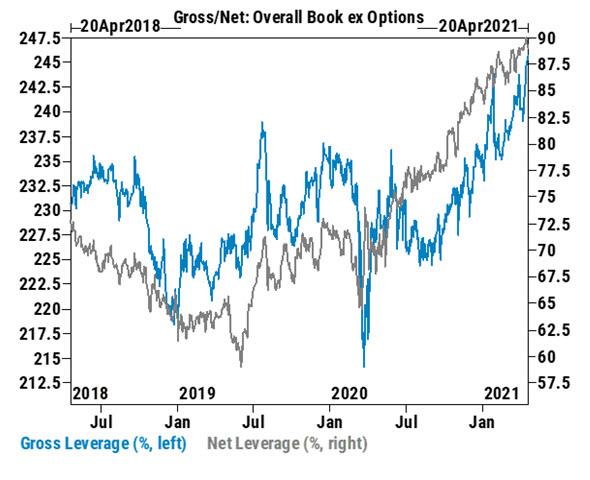
And while the article echoed many of the stats we have discussed previously, what was left unsaid is just how broken the market has become as a result of this unprecedented bullish pile up which has not only eradicated all the shorts but has pushed hedge funds all in to never before seen levels, with Goldman’s Prime Brokerage noting last week that hedge fund gross leverage is now the highest on record.
So in a much needed follow up, this weekend Bloomberg looked at the practical implications of what happens when everyone is bullish and – to nobody’s surprise really – found that conventional sell signals no longer work at all, or as it put it “If you bailed because of Bollinger Bands, ran away from relative strength or took direction from the directional market indicator in 2021, you paid for it.”
It’s testament to the straight-up trajectory of stocks that virtually all signals that told investors to do anything but buy have done them a disservice this year. In fact, when applied to the S&P 500, 15 of 22 chart-based indicators tracked by Bloomberg have actually lost money, back-testing data show. And all are doing worse than a simple buy-and-hold strategy, which is up 11%.
Repeating something we have hammered since… oh…. 2009 when we first said that nothing makes sense in a “market” that is manipulated, controlled and micro-managed by central banks, Bloomberg summarizes this exercise as “a reminder of the futility of calling a market top in a year when the journey has basically been a one-way trip.”
“What we’ve seen this year is a very strong up market that didn’t get many pullbacks,” Larry Williams – creator of the Williams %R indicator that’s designed to capture a shift in a security’s momentum – told Bloomberg A long-short strategy based on the technique is down 7.8% since the end of December.
“All the overbought and oversold indicators, mine as well as anybody else’s, didn’t get many buy signals, but a lot of sells,” he said.
And yet stocks just kept grinding higher. Indeed, earlier this month, the S&P soared 16% above its 200-day average, a feat that before December had occurred only a handful times over the past three decades, and usually led to sharp selloffs. Moreover, the benchmark’s relative strength index (RSI) has surpassed 70 on both a weekly and monthly basis, a sign that the market has risen too far, too fast. Which, however, does not stop the market from rising even more and even faster.
Paradoxically, the melt up continued even as hedge funds took heed of all the signals screaming “sell”, and hit the exits this month, selling for 7 of the past 8 days through Wednesday and stampeding out of tech stocks just days before Apple and Amazon report financial results this week.
Add in pundits warning of bubble-like valuations and resurgent coronavirus concerns, and it’s a recipe for sell orders. Yet the S&P just closed on Friday within a hair of its all time high…
In turn, this is a reminder that avoiding the so-called “market” – which is now anything but – for any period of time has become the riskiest wager of all. The S&P 500 has yet to retrench more than 5% this year. At the same time, missing out on the big up days is more penalizing than ever. Absent the top year’s five sessions, the index’s 11% gain dwindles to 2% according to Bloomberg.
“To try to guess that this is the right time to be out of the market, you may as well go to Las Vegas,” said Mark Stoeckle, chief executive officer at Adams Funds. “There’s just as much risk doing that.”
Empirically, this is certainly true: Bloomberg conducted a back-testing experiment which purchases the S&P 500 when an indicator signals a “buy” and holds it until a “sell” is generated. At that time, the index is sold and a short position is established and kept until a buy is triggered.
One such test followed RSI signals to buy and sell the market, and has lost 10% this year. The damage occurred as stocks entered the year with unbridled momentum that touched off an order to sell. The trade has since been in place as the S&P 500 never pulled back fast and long enough to flash buy.
Another test involved the MACD (or moving average convergence/divergence) indicator, which suffered a similar loss of 9.8%. Five of the nine trading signals that the model has produced have been buys, and four of them have lost money. In addition, all four short recommendations have been losers.
And as bears get crushed, sell signals annihilated, and fundamentals become a joke, the S&P 500 has already eclipsed the average Wall Street strategist’s year-end target, and we’re not even 4 full months into the year!
“Today, and for much of 2020, the overbought conditions have been absorbed by the market with more strength, or at best a pause,” said Renaissance Macro Research co-founder Jeff deGraaf, who ranked as the top technical analyst in Institutional Investor’s annual survey for 11 straight years through 2015 and who now finds his job obsolete. “Overbought/oversold conditions are useless without first defining the underlying trend of the market.”
Right, Jeff… but what is this “market” you speak of?
Williams, who has been trading since 1962, agrees, because he too now finds himself trying to predict a future looking at lines and squiggles and failing miserable. According to him, “technical analysis tools aren’t broken but in a bull market that’s as resilient as this one, investors need to use them in the right context.”
“You have to have a different tool, if you will, for a job you’re doing,” he said. “I have a hammer that can build a house, but if I use the hammer to dig a hole in the ground, that’s going to be really hard.”
Sorry Larry, but your delightful – if completely meaningless analogy notwithstanding – not only has technical analysis become an even greater joke than usual, but there is no market – there is just a vast pool of liquidity where trillions of fiscal and monetary stimulus end up… and which makes the rich even richer until one day it all is destined to blow up. The only question that matters – dear technical and fundamental analysts – is when that day comes. Everything else is just the continued meltup leading up to this D-Day for capital markets.
Tyler Durden
Sun, 04/25/2021 – 13:15![]()
Zero Hedge’s mission is to widen the scope of financial, economic and political information available to the professional investing public, to skeptically examine and, where necessary, attack the flaccid institution that financial journalism has become, to liberate oppressed knowledge, to provide analysis uninhibited by political constraint and to facilitate information’s unending quest for freedom. Visit https://www.zerohedge.com