Lessons To Learn From The Recent Decline
Authored by Lance Roberts via RealInvestmentAdvice.com,
Stocks Snap The 6-Month Win Streak. What Happens Next?
In mid-August, we discussed the rarity of markets churning out 6-positive months of returns in a row. To wit:
“Using Dr. Robert Shiller’s long-term nominal stock market data, I calculated positive monthly returns and then highlighted periods of 6-positive market months or more.”
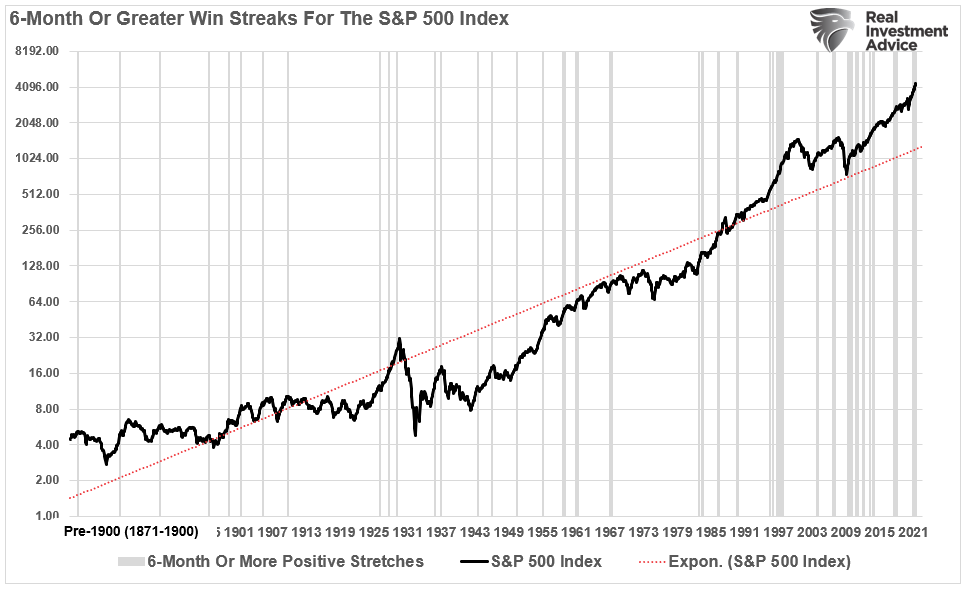
Importantly, all periods of consecutive performance eventually end. (While such seems obvious, it is something investors tend to forget about during long bullish stretches.)
The data shows that nearly 40% of the time, two months of positive performance gets followed by at least one month of negative performance. Since 1871, there have only been 12-occurrences of 6-month or greater stretches of positive returns before a negative month appeared.
For September, the S&P turned in a negative 4.89% return. While the decline was average for a market correction period, the financial media made it sound like the market just “crashed.”
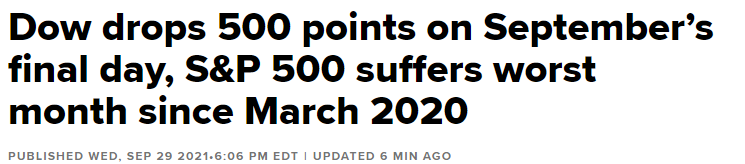
These types of headlines tend to drive investors to make emotional decisions. However, while it appears the market won’t quit declining, the correction was much needed.
Seasonally Strong Period Approaches
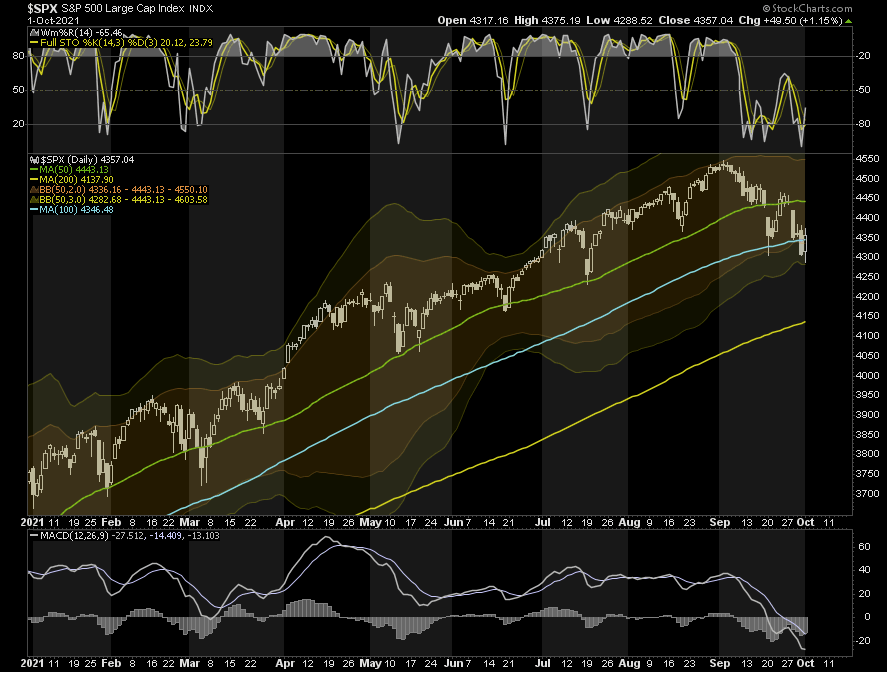
With the market now pushing into 3-standard deviation territory below the 50-dma and oversold technically on other measures, the reflexive rally on Friday was not surprising.
As noted in our daily commentary (subscribe for free email delivery):
“We agree with Stocktrader’s Almanac:
“Many of the same geopolitical, political, fundamental, and technical headwinds we highlighted in the September and October Outlooks remain present. Congress passed the funding bill to avert a government shutdown just before the market closed today ahead of the September 30 midnight deadline. The biggest risk to the market remains the Fed. An uptick in taper talk or chatter about the Fed raising rates ahead of schedule could trigger another selloff.”
However, it is worth noted there are two primary support levels for the S&P. The previous July lows (red dashed line) and the 200-dma. Any meaningful decline occurring in October will most likely be an excellent buying opportunity particularly when the MACD buy signal gets triggered.
The rally back above the 100-dma on Friday was strong and sets up a retest of the 50-dma. If the market can cross that barrier we will trigger the seasonal MACD buy signal suggesting the bull market remains intact for now.
“Seasonality is alive and well. So we stick with system. “ – Stocktrader’s Almanac
If you didn’t like the recent decline, you have too much risk in your portfolio. We suggest using any rally to the 50-dma next week to reduce risk and rebalance your portfolio accordingly.
While the end of the year tends to be stronger, there is no guarantee such will be the case. Once the market “proves” it is back on a bullish trend, you can always increase exposures as needed. If it fails, you won’t get forced into selling.
Lessons To Learn From The Recent Decline
As noted, we expected the recent decline and previously discussed raising cash and reducing risk. Such allowed us to weather to correction without losing (too much) sleep at night. However, for most, the recent decline brought to light just how much risk exposure many have in portfolios.
While the decline was minimal, many investors suffered damage far more significant than the overall market decline. Such came from two sources:
-
For those “doing it themselves,” much of the damage came from more speculative stocks investors piled into to chase market returns.
-
Individuals who had financial advisors, also suffered damage as they put their “financial advisors” into the position of chasing market returns or suffering career risk.
Such should not be surprising. I consistently meet with individuals who swear they are conservative when it comes to investing. They don’t want to take any risk but require S&P 500 index returns.
In other words, they want the impossible:
“All of the upside reward, but none of the downside risk.”
The lesson we seem to need to learn continually is the understanding of risk. The demand for performance above what is required to reach our goals requires an exponential increase in risk. When clients demand greater returns, such forces advisors to “chase returns” rather than “do what is right” for the client.
For the advisor, such leads to “career risk.” Specifically, if the advisor doesn’t acquiesce to client demands, they lose the client to another advisor who promises the impossible.
Such is why “buy and hold” index investing has gained such popularity with advisors. If the market goes up, clients get market returns. When the market crashes, the excuse is,
“Well, no one could have seen that coming. But remember, it’s ‘time in the market’ that matters.”
Media Driven Hype
While the advisor takes no liability for giving clients average performance, the client loses the ability to reach their financial goals.
“But if I had been conservative, I would have missed out on the bull market.”
Almost daily, there is some advisory firm, financial media type, etc., suggesting that you need to buy and hold an S&P 500 index fund if you want to get rich.
During bull markets, such advice certainly seems sound. But, unfortunately, during bear markets and even near 5% corrections, the error of excessive risk becomes prevalent.
The truth is that a more conservative approach to investing can not only get you to your financial goals intact but can do so without triggering the numerous emotional mistakes that lead to worse outcomes.
Shown below is the total inflation-adjusted return of stocks versus bonds. Since 1998, the difference between a 100% stock versus a 100% bond portfolio is just $50. More importantly, during the two major bear markets, an all bond portfolio vastly outperformed with much lower volatility.
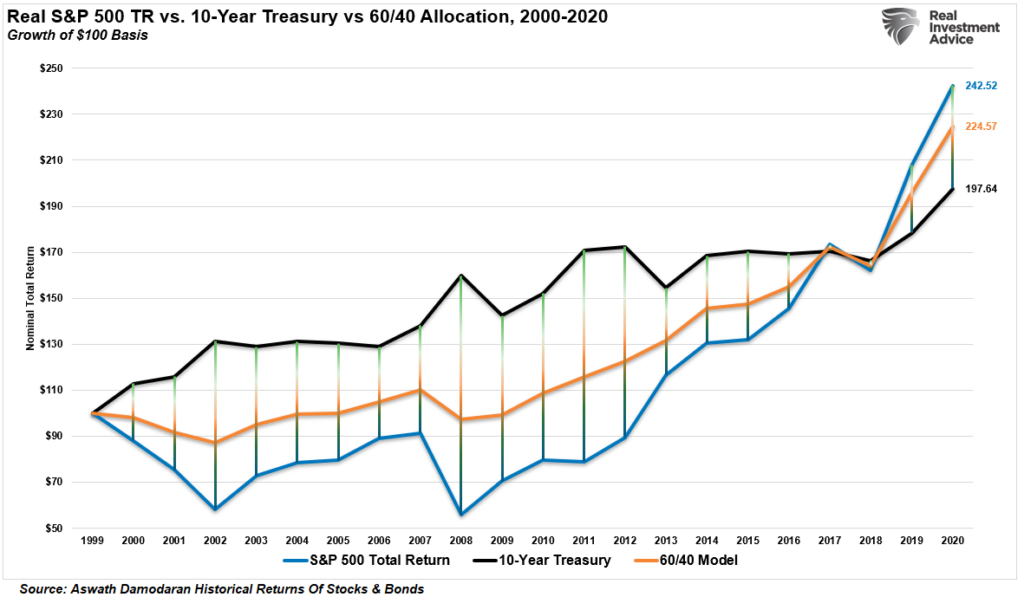
A 60/40 blend performed substantially better than an all-stock portfolio and currently only lags by $18. An all-bond portfolio outperformed an all-stock portfolio until 2019. That underperformance will likely revert to outperformance over the next decade.
It is hard to resist getting caught up in an accelerating market.
However, remember that while the cost of entry into the casino is cheap, the exit can be expensive.
Things You Can Do To Perform Better (And Sleep At Night)
Here are the core principles we use with every one of our clients.
-
Understanding that Investing is not a competition. There are no prizes for winning but there are severe penalties for losing.
-
Checking emotions at the door. You are generally better off doing the opposite of what you “feel” you should be doing.
-
Realizing the ONLY investments you can “buy and hold” are those that provide an income stream with a return of principal function.
-
Knowing that market valuations (except at extremes) are very poor market timing devices.
-
Understanding fundamentals and economics drive long term investment decisions – “Greed and Fear” drive short term trading. Knowing what type of investor you are determines the basis of your strategy.
-
Knowing the difference: “Market timing” is impossible – managing exposure to risk is both logical and possible.
-
Investing is about discipline and patience. Lacking either one can be destructive to your investment goals.
-
Realize there is no value in daily media commentary – turn off the television and save yourself the mental capital.
-
Investing is no different than gambling – both are “guesses” about future outcomes based on probabilities. The winner is the one who knows when to “fold” and when to go “all in”.
-
Most importantly, realizing that NO investment strategy works all the time. The trick is knowing the difference between a bad investment strategy and one that is temporarily out of favor.
Markets are not cheap by any measure. If earnings growth continues to wane, economic growth slows, not to mention the impact of demographic trends, the bull market thesis will fail when “expectations” collide with “reality.”
Such is not a dire prediction of doom and gloom, nor is it a “bearish” forecast. It is a function of how the “math works over the long term.”
Not Out Of The Woods Just Yet
Yes, September was a rough month for the market. However, as we noted previously, a 5-10% correction would “feel” much worse due to the high levels of complacency. Judging by the amount of “teeth-gnashing” on the financial media, you would have thought the roughly 4% correction for the month was a massive bear market.
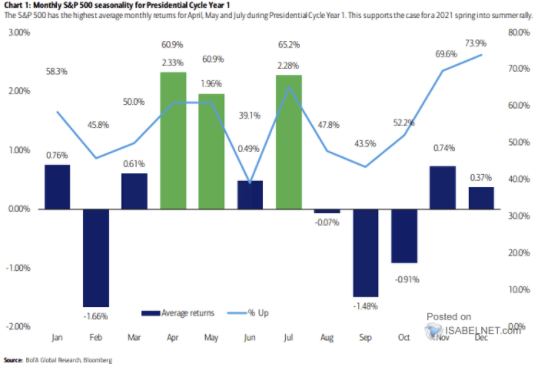
With the recent sell-off working off some short-term overbought conditions, the market is now better positioned for the “seasonally strong” period. As shown, while October can also tend to be a weaker month, it tends to be stronger than September. November and December are usually well into the green.
However, such is not a guarantee. The end of 2018, as the Fed was tapering its balance sheet and hiking rates, was not a positive experience for investors.
While the Fed is likely many months away from hiking interest rates, they are some very definite headwinds facing stocks into year-end.
-
Valuations remain well elevated.
-
Inflation is proving to be much sticker than expected.
-
The Fed will likely move forward with “tapering” their balance sheet purchases in November.
-
Economic growth continues to weaken
-
Corporate profit margins will shrink due to higher inflationary pressures.
-
Earnings estimates will get revised downward keeping valuations elevated.
-
Liquidity is contracting on a global scale
-
Consumer confidence continues to wane
While none necessarily suggest a more significant correction is imminent, they will make justifying current valuations more difficult. Moreover, with market liquidity already very thin, a reversal in market confidence could lead to a more significant decline than currently expected.
Such is why we have been adding bonds as of late.
Bob Farrell’s Rule #5
Bob Farrell once quipped that investors tend to buy the most at the top and the least at the bottom. Such is simply the embodiment of investor behavior over time.
Our colleague, Jim Colquitt of Armor ETFs, reminded us of that axiom with a recent post.
The graph below compares the average investor allocation to equities to S&P 500 future 10-year returns. As we see, the data is very well correlated, lending credence to rule #5. Note the correlation statistics at the top left of the graph.
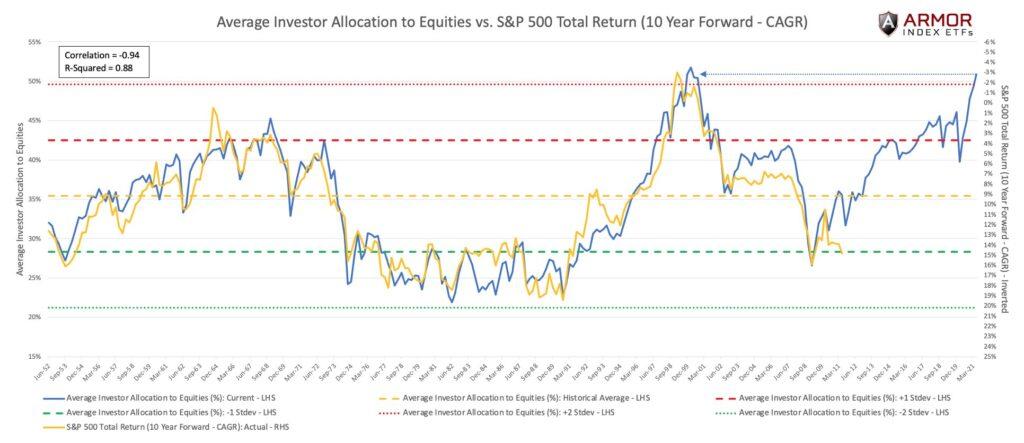
More importantly, current allocations to equities are more than two standard deviations above the norm. Per Jim:
“Since 1952, we’ve only had 4 quarterly observations above the two standard deviation line. Each of which resulted in negative returns (CAGR) for the subsequent 10 years. We now have a 5th.”
Over the next decade, there is a genuine possibility that bonds will provide a higher return than equities on a “buy and hold” basis.
Such is something worth considering.
* * *

Tyler Durden
Sun, 10/03/2021 – 10:30![]()
Zero Hedge’s mission is to widen the scope of financial, economic and political information available to the professional investing public, to skeptically examine and, where necessary, attack the flaccid institution that financial journalism has become, to liberate oppressed knowledge, to provide analysis uninhibited by political constraint and to facilitate information’s unending quest for freedom. Visit https://www.zerohedge.com