“When Price No Longer Matters” – How QE Destroyed Price Discovery And The Free Float Of Government Debt
There is a simple reason why we have been getting increasingly more frequent headlines such as these in recent years: Not a Single Japanese 10-Year Bond Traded Tuesday, How BOJ Crushed Trading in Japan’s $10 Trillion Bond Market, Trading in Japanese government bonds is drying up. Does that matter? That reason is that as price indiscriminate central banks soak up increasingly more in Treasury supply from the private sector, the entire price discovery process becomes corrupted to the point where arms-length transactions are no longer required, or even take place, as markets anticipate central banks to set prices without outside intermediation.
And while we have been discussing the growing illiquidity and the decline in Treasury market trading for nearly a decade, others are catching up, and in a recent chart, Deutsche Bank flagged that the share of government debt held by “price sensitive” investors – what the ECB dubbed dubbed the Free Float – has been falling in recent years across major economies and particularly in Germany, where it is now below 10%!
And since QE is set to come back with a furious vengeance once the current period of transitory tightening (see, there is one thing that is truly transitory these days, and that is the period of time that central banks think they can tighten/hike rates/not engage in gross debt monetization, everything else is a joke). ends, below we take a more detailed look at the drivers and potential impact of these dynamics.
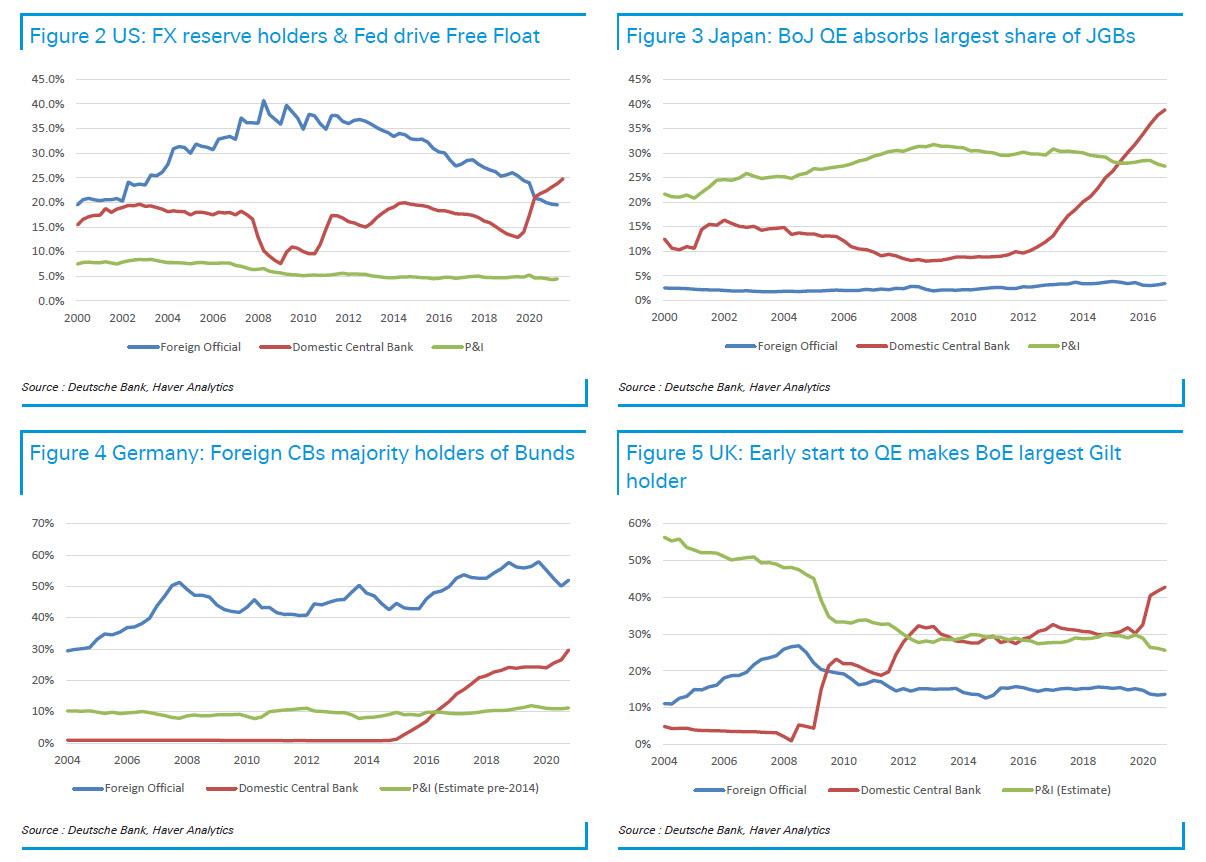
For those pressed for time we will generously cut to the punchline: while large FX reserve holdings of Treasuries and Bunds by foreign central banks drive the Free Float in the US and Germany, QE is unsurprisingly the key factor in the declining free float in the other analyzed countries. Yes, for all the Fed’s posturing about the broken Treasury market (see “Two Fed Presidents Hit The Alarm Over The Broken Treasury Market… Which They Caused“) it is the Fed, and only the Fed, that is responsible for the upcoming historic bond market crash.
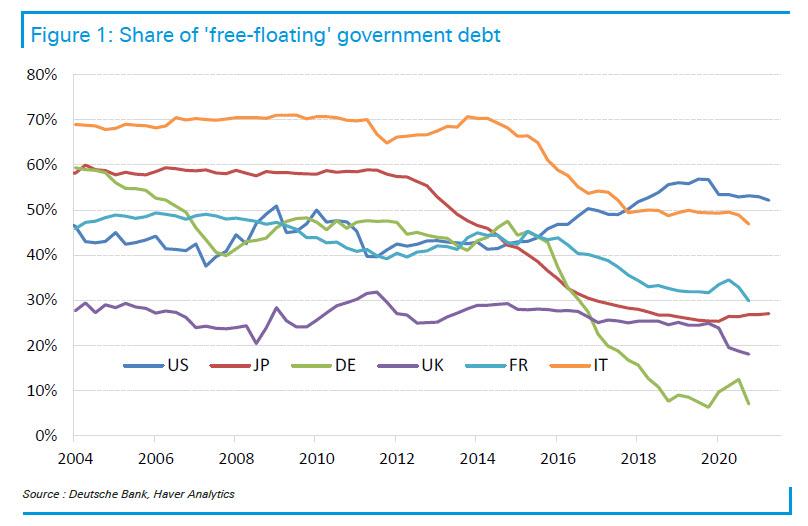
So what drives Free Float across countries?
The ECB defines the Free Float as the share of outstanding government debt held by price sensitive investors, i.e., excluding holdings by the domestic central bank (QE), foreign central banks (FX reserves) and pension funds & insurance companies (ALM demand). The charts below show how the holdings of these three sectors (in percent of outstanding government debt) have evolved across the 6 largest DM economies.

Combining the data of the 6 analyzed countries into a ‘global’ series, the chart below courtesy of Deutsche Bank shows a steadily declining Free Float share over the past 15 years.
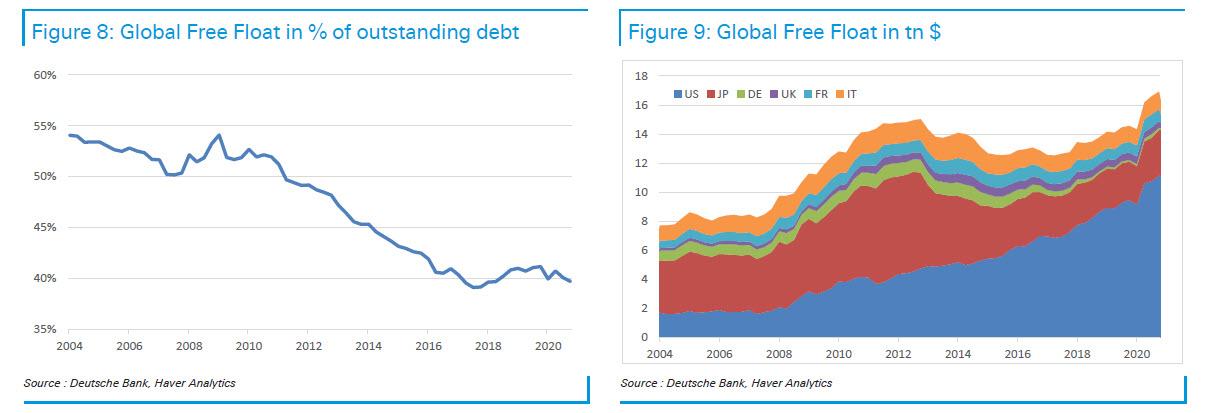
As the chart on the left shows, the aggregate free float in the six top countries has fallen from around 50-55% in the years before and just after the GFC to around 40% today.
Said otherwise, price-indiscriminate entities account for more than half the free float of global outstanding debt; this means that the price of the most important security across the world – the one that is still viewed by some as the “risk free” asset – is no longer determined by the free market but by a handful of fat, balding academics who have never stepped a foot inside the real world.
This is the most important factor explaining not only the rising fragility of the bond market – so theatrically lamented by Fed presidents, i.e., the biggest perpetrators – but also the enduring decline of the term premium. Figure 10 and Figure 11 show how DB’s preferred measure of the 5s10s term premium in both the US and the euro area decreased alongside the Free Float.

Another observation from the data above: the ever growing influence of QE has been offset by a reduction of foreign official holdings for the US (a great way to disintermediate Chinese Treasury purchases from the fate of US deficit funding). Also of note, even though Japan has a debt/GDP of nearly 240% the free float is less than 30% with QE being the biggest part there.
Why does this matter? Because as one can see in the 6 standalone charts breaking down the free float by country, which shows how the price insensitive holdings have evolved over the last couple of decades, one can better understand financial repression and why real yields are so negative, a topic we covered extensively on Friday in Real Rates At Levels Associated With “Panics, Wars, & Depression”… And What Comes Next Could Be Devastating…
Tyler Durden
Sun, 11/21/2021 – 13:10
Zero Hedge’s mission is to widen the scope of financial, economic and political information available to the professional investing public, to skeptically examine and, where necessary, attack the flaccid institution that financial journalism has become, to liberate oppressed knowledge, to provide analysis uninhibited by political constraint and to facilitate information’s unending quest for freedom. Visit https://www.zerohedge.com