Should You Sell On Friday?
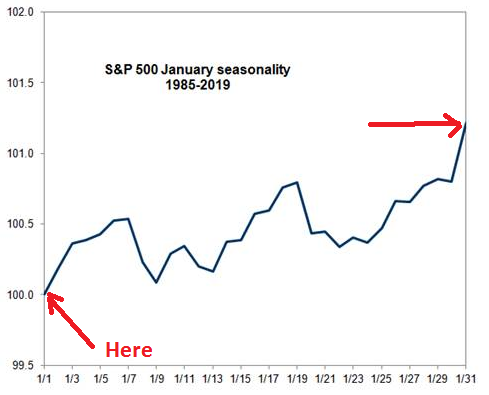
The key pillar in Goldman’s extremely bullish January outlook (which however does not extend to the rest of 2022 as we noted earlier) is that just the favorable seasonality of the “January Effect” is enough to supercharge markets in the first weeks of the coming year.
But courtesy of analysis from DataTrek’s Nick Colas, a question has emerged: is Goldman’s seasonal euphoria misguided, or even flawed?
The reason is that as Colas points out, after the S&P 500 registers a total annual return of +20 pct (currently up +27.6 YTD), it’s flat on average in the following January. This is much worse than the average Jan return (+1.2 pct) and history shows there can be sizeable drawdowns in the first month of a new year after an outsized gain. Needless to say, this is precisely the opposite thesis to that pitched by Goldman’s super bullish trading desk.
Which then leads to the question: should you sell on Friday ahead of a disappointing January (and as all those who bet on Goldman’s meltup extending into January, end up puking)?
Here are DataTrek’s thoughts on the matter.
With the S&P 500 up 27.6 pct year-to-date and just 3 trading days left in 2021, what can investors expect for January 2022? History shows the January after a strong year can be a mixed bag. Here is the data:
#1: Since 1980, when the S&P 500 has a +20 pct total return in a given year, the January of the following year is – on average – almost exactly flat (-0.09 pct mean price return). Whether the index was positive in January was a coin flip, up 8 in years and down in 8 years. The worst return was -6.9 pct in January 1990 and the best was +6.1 pct in January 1997.
Focusing on just the first 5 trading days of January after a robust year for the S&P, the index gains 72 basis points on average. Since 1980, it has been higher about two-thirds (69 pct) of the time over the first week of the new year.
Takeaway: The S&P is flat on average in the January following an especially robust year for the index and there’s a wide distribution of returns. That’s despite a +1.2 pct average January return since 1928. While the S&P is usually slightly higher during the first 5 trading days after a strong annual performance, this positive momentum fades. There were also 5 years in which the index fell by over 3 pct in January after a strong return in the prior year: 1990 (-6.9 pct), 2000 (-5.1 pct), 1981 (-4.6 pct), 2010 (-3.7 pct) and 2014 (-3.6 pct).
#2: The S&P will almost certainly deliver a third consecutive year of double-digit returns (2019: +31 pct, 2020: +18 pct, 2021 YTD: +27.6 pct), so here is the January return data after the only 9 other times this has happened over the last +90 years:
-
In the January after the nine prior 3-year sequences, the S&P rallied an average of 74 basis points and was higher during the month two-thirds of the time. The worst return was -5.1 pct in January 2000 and the best was +7.0 pct in January 1946.
-
During the first 5 trading days of the year, it returned an average +53 basis points and was higher two-thirds of the time.
Takeaway: after 3 years of double-digit annual returns, the S&P continues to rally during the first 5 trading days of the new year and ends slightly higher for the month of January. That said, the last two times the S&P saw a 3-peat of double-digit annual returns, it was down 5.1 pct (Jan 2000) and 3.1 pct (Jan 2015) respectively in the following January.
#3: The S&P could very well end the year up over +30 pct on a total return basis, which has only happened 8 times since 1980; here is the return data for the following Januarys:
-
The S&P dropped by an average of 52 basis points during the first 5 trading days of the following year. It was down during this period half the time.
-
The index fell by an average 158 basis points in January overall. It was down 63 pct of the time. The worst January return was -6.9 pct in 1990 and the best was +3.3 pct in 1996.
Takeaway: after an unusually large total annual return for the S&P (+30 pct), the index typically starts to give back some of those gains during the first month of the new year. The S&P has only rallied +30 pct in two years over the last two decades, up 32.2 pct and 31.2 pct in 2013 and 2019 respectively. The S&P fell 3.6 pct in January 2014 and lost 0.16 pct in January 2020.
Bottom line: investors shouldn’t expect this year’s positive momentum to carry through next month. Even though the S&P is flat on average in January after a particularly robust year, it has a wide distribution of returns. There’s a raft of reasons why the index suddenly turns lower in the new year, from de-risking and mid-cycle concerns to a worsening economic outlook. We are still bullish on US equities because we believe US corporate earnings will remain strong, but the bearish examples listed above are worth considering as you decide how much equity exposure you want to carry into early 2022.
Tyler Durden
Wed, 12/29/2021 – 09:45
Zero Hedge’s mission is to widen the scope of financial, economic and political information available to the professional investing public, to skeptically examine and, where necessary, attack the flaccid institution that financial journalism has become, to liberate oppressed knowledge, to provide analysis uninhibited by political constraint and to facilitate information’s unending quest for freedom. Visit https://www.zerohedge.com