The Ultimate Supply And Demand Equation
Let’s talk about asset shortages.
If you’re active on fintwit then you’ve probably heard people mention the possibility of a coming asset shortage squeeze — I myself, have been mulling the idea over.
But the concept is a fuzzy one. There’s little research on the topic. Very few people are aware of the idea and its impact. And even those that do talk about it, have serious misconceptions of how it actually works.
Even more importantly, it’s a useful model to apply in our framework for analyzing market cycles — it’s at the heart of what drives bull markets (hint… it’s not earnings). It also ties into our debt cycle model and is likely to become an important driver of market returns over the coming year. So knowing what it is and how it works will put us ahead of the market… which is where we want to be.
Everything in markets comes down to supply and demand. Our job as speculators is to figure out the two and see if there’s a mismatch that will lead to a price change (a trend). So let’s start by defining market demand.
Investors can allocate their savings to three main assets: stocks, bonds, and cash. They make these allocation decisions based on desired returns and tolerance for risk to come up with a portfolio mix — the classic being m60% in stocks and 40% in bonds/cash. Recent price appreciation (not valuation or yield) is the overwhelming driver behind this allocation decision. Momentum is the bottom line, which means investors are always chasing the trend — nobody likes sitting out of a rising market.
Savings — the amount of money available to invest — fluctuates according to the levels of cash + credit (money) in the system. Since credit is easier to create than cash (any two willing parties can create credit out of thin air with an IOU), credit largely drives the amount of investable money in the system. Rising lending equals more savings to invest. The amount cycles up and down in accordance with our debt cycle framework.
The supply side of financial assets is comprised not just of the total amount of shares or bonds in existence, which is what many people mistakenly think. Rather, it’s the market value — the total dollar amount in existence at current market prices — that makes up supply.
This means that the equity market has a flexible supply. If the demand for stocks increases then those flows will drive up prices along with the overall market value thus creating more supply to meet that demand. It’s a system that automatically self-corrects over time.
The bond market, on the other hand, has a theoretical supply limit.
There’s a ceiling on the market value of bonds because credit shouldn’t trade much above the price which corresponds to a 0% yield to maturity. It used to be thought that this was an iron-clad rule. But after years of NIRP, we now know that bonds can and do trade above this limit, in which their yield is negative. But even here, they can only trade so far above this level that there’s a range that serves as a limit on bond market value and hence supply.
So to summarize, the basics of our supply and demand model is: On the demand side we have:
- a. The amount of savings available to invest is largely driven by the credit cycle
- b. The allocation mix of investor portfolios is largely driven by performance chasing
On the supply side we have:
- a. Supply is made up of the total market value of the asset and this market value is equal to the number of shares + the price at which they trade
- b. Stocks have a flexible supply in that greater demand leads to higher market value and more supply
- c. Bonds have a theoretical limit in that they can’t trade much below 0% interest rates
- This is a very different kind of thinking about what moves the market. It’s the model that Stanley Druckenmiller was referring to when he said:
Earnings don’t move the overall market; it’s the Federal Reserve Board… focus on the central banks and focus on the movement of liquidity… most people in the market are looking for earnings and conventional measures. It’s liquidity that moves markets.
Liquidity is credit-driven investment demand. This isn’t to say that earnings don’t matter. They do, especially on an individual company level. But on the aggregate, earnings are largely a result, not the cause of, the liquidity-driven short-term debt cycle.
We can look back through time and see how this model correlates to market returns.
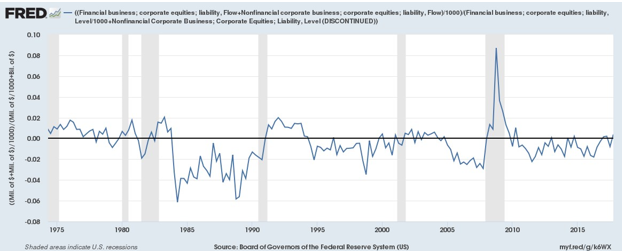
Historically, US corporate share issuance has rarely exceeded 2% and over the last three and a half decades corporates have been actively reducing their share count through buybacks and M&A at an average annual rate of 2%. The chart below shows net corporate share issuance.
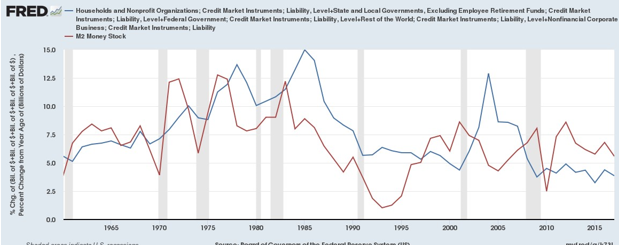
While the number of shares has been falling, the amount of money (cash+credit), has been steadily increasing. Over the last 50 years, the US’s money stock has been rising at an average annual rate of 8% a year. The chart below shows total new credit (blue line) and M2 cash stock (red line).
So over the last five decades, we’ve had the supply of equity shares shrinking by an average of 1-2% a year, through buybacks and M&A. And we’ve had the total money stock increasing at an average rate of 8% a year. Disregarding total market value and investor allocation preferences for a second, this gives us a supply/demand mismatch of roughly 9.5% a year. Well, guess what the average annual return has been on the stock market over the same period? That’s right…9.5%.
The stock market’s average annual returns equal the supply/demand mismatch of share reduction and money creation over the same period. This isn’t a coincidence. It’s just math. You see, if investors keep their portfolio mix (their allocation preference between stocks, bonds, and cash) relatively constant, then the market value of stocks has to rise at the same level of the supply and demand imbalance between share reduction and money creation.
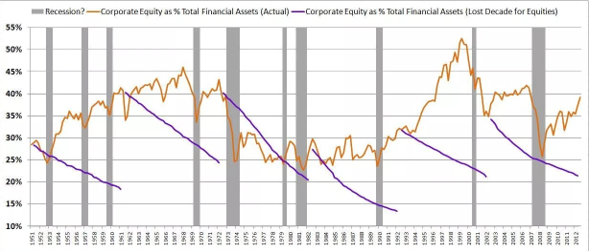
If not, investors’ allocation to equities will dwindle relative to bonds and cash and the market value of stocks will fall on a relative basis to the amount of investable savings. We can see what this would look like on the chart below via Philosophical Economics. The chart shows how much the investor allocation to stocks would decrease if the market went through a “lost decade” period; where the share count/money demand imbalance grew at its historical rate, but stock prices stayed constant. The purple line shows the allocation to equities over each hypothetical “lost decade” period and the orange line shows what the actual allocation to stocks was.
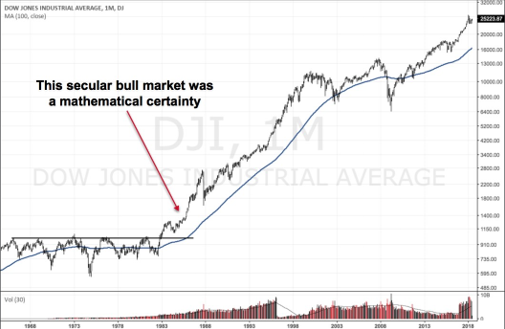
So we can see, the market has to rise over time because we operate in an inflationary market system, where the quantity of money is nearly always growing and the corporate sector’s aversion to dilution keeps share growth at a minimum to net negative. The only way for the market to clear — for supply and demand to balance — is for the market’s total value to rise, increasing the supply to meet the demand. If you were trading back in the early 80s and you understood this market supply and demand model, you would have foreseen the massive secular bull market that was mathematically inevitable.
In the early 80’s we saw a perfect storm that led to a huge imbalance between the supply of equities (shares issued plus total relative market value) and demand (total money creation plus investor allocation).
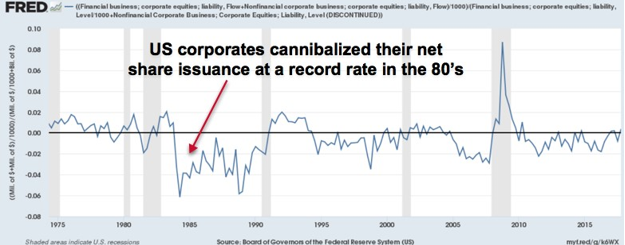
We can see that following the 1981 recession both money creation ballooned to all-time highs and corporates saw record net negative share issuance.
At the same time, investors’ allocation to stocks hit an all-time low of 12%! The chart below shows a household’s allocation to equities as a percentage of total financial assets.

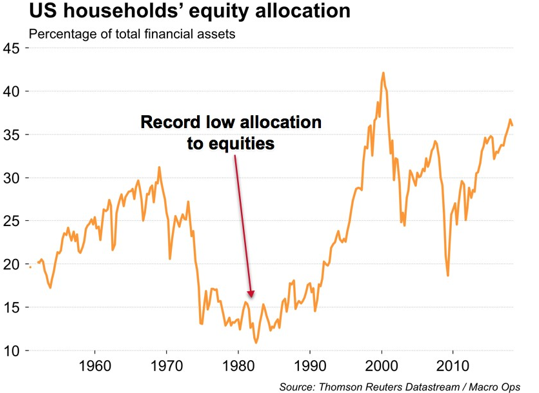
At that rate of money creation and net share decline, investors’ allocation to stocks would have had to fall to near zero just to keep the market from rising.
The secular bull market HAD to happen so that the market’s total value could rise, bringing supply up to meet demand and allowing the market to clear.
Tyler Durden
Sun, 01/09/2022 – 17:30
Zero Hedge’s mission is to widen the scope of financial, economic and political information available to the professional investing public, to skeptically examine and, where necessary, attack the flaccid institution that financial journalism has become, to liberate oppressed knowledge, to provide analysis uninhibited by political constraint and to facilitate information’s unending quest for freedom. Visit https://www.zerohedge.com