
“We’re Trapped In A Regime Of Grind-Up/Gap Down Where The Index Doesn’t Sustain A Directional Trend”
By Tony Pasquariello, head of Goldman Hedge Fund coverage
Don’t bury the lead: the US economy is proving to be a lot more durable than many market participants expected just a couple of months ago.
If there was a cohesive takeaway from this week’s data set — notably retail sales, homebuilder sentiment and jobless claims — it’s consistent with that headline: as we pass the point of peak FCI drag, the flow of news has generally been breaking to the stronger side (with a pronounced skew towards the hard data).
With that, however, comes an element of complexity: the inflation data this week was a bit tricky; so too was the sequence of Fed commentary.
In turn, day-by-day and brick-by-brick, the terminal rate is pushing higher … in a manner that generally wasn’t intimidating for the stock market … until it was (specific to the high velocity / long duration parts of the market, which lost their immunity to higher rates as the week wore on).
With that level set, here’s how I’d unpack things:
- CPI was non-traumatic and broadly consistent with the disinflation narrative — though not without some underlying tensions — and PPI certainly delivered an unexpected pinch.
- Retail sales were strikingly strong, full stop.
- Jobless claims continue to print sub-200k, illustrative of what you know: the American labor market is rock solid.
- Fedspeak clearly tilted towards the need to do more, as both Mester and Bullard made the market re-think the near-term distributions of policy (while they are both hawks and non-voters, as we saw on Thursday, the market didn’t discriminate).
To this point in the email, the moral of the story is clear: the US economy is impressively strong and the Fed has more wood to chop.
- Given all of this, the most significant move across the macro landscape took place in the most important asset of them all — US interest rates — which featured a notable break higher in yields (see chart 12 below) as implied cuts quickly bleed out of the strip (witness SFRZ3 is over 75 bps higher in yield vs just one month ago).
- Within that environment, our franchise equity flows remain robust, if very uneven; here’s the sequence: two weeks ago, GS Prime Brokerage reported the largest short covering in eight years … last week saw the biggest selling by hedge funds in seven weeks, as those index shorts were reset … and this week was a tale of two cities, as meaningful demand early in the week (very notably in tech) then gave way to aggressive selling.
- Furthermore, the shine may be coming off some of those non-dollar trades … while Europe continues to generally impress (more on this below), note that EM and Asian markets had a tough week (after a scorching start, that makes three in a row for China).
In the end, neither the bulls nor the bear really won the week (S&P -28 bps), but there are many folks who want to believe there’s not much gas left in the tank … on the logic that the YTD rally has been driven by low quality, if fleeting leadership (that’s a polite way to put it) and non-fundamental buyers who won’t stay in the fight (e.g. the CTA community is now running max long).
Where do I come out?
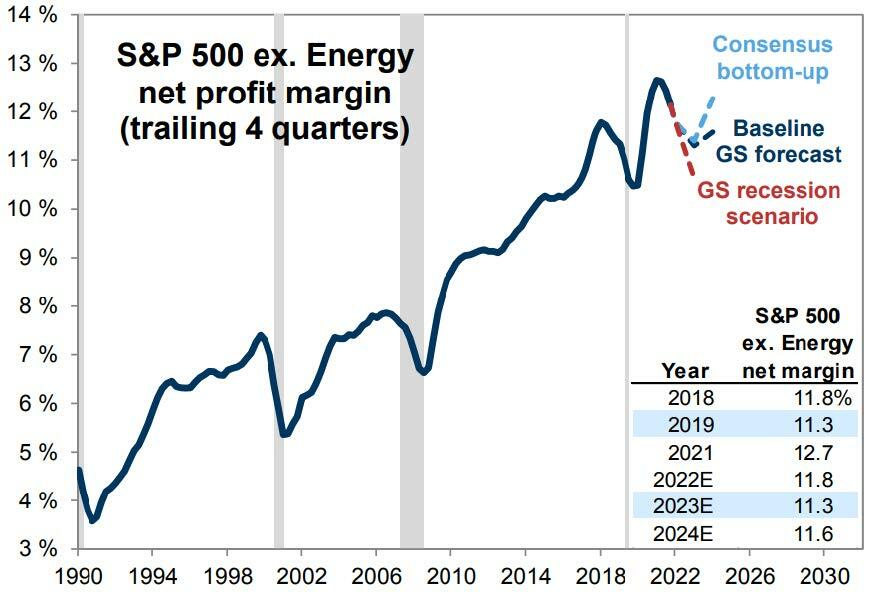
- Fundamentally, while the US economy is admirably durable, I worry that expansion of the P/E multiple amidst ongoing earnings downgrades feels untenable (related: see chart 9 below for a level set on margin expansion, or the lack thereof) … particularly if we’re settling in for a higher-for-longer tightening cycle where several more 25’s come down.
- Tactically, while I believe that the general thrust of money flow is still supportive (stock buybacks, specifically, should offer ongoing ballast to the market), given the rapid shift in fast money positioning and sentiment, I don’t necessarily love the short-term technicals (this is good: link).
- So, in terms of price action from here, I think this week only added weight to the view that we’re still entrapped in a regime of grind-up / gap-down where the index doesn’t sustain a large directional trend.
- Here’s what I find interesting about all this: while so much has fundamentally changed versus six months ago, the tactics of navigating S&P really haven’t … sell rips and buy dips (for a clever way to prosecute this view, GBM colleague Matt Fleury has a Dec ’23 expiry double no touch idea that passes the common sense test).
What follows from here are some additional thoughts on a few of the big variables in the game, and a set of charts that may provoke a certain reaction:
1. Inflation and the Fed: for those keeping score at home, that’s seven consecutive months of a lower headline on CPI. We went into this print knowing, to some extent, the market had already made up its mind on inflation — just have a look at those forward breakevens — and there wasn’t enough to reverse that narrative. Now, while I’m not smart enough to pick a fight with the TIPS market, I also wouldn’t spin CPI as overly tame (I’m looking at you, shelter) … Again, PPI was an unexpected pinch … and, I’d humbly posit that the Fed is still missing their mark by over 2x. Finally, if they want to achieve their objectives, we need to see payrolls below 100k, not above 500k.
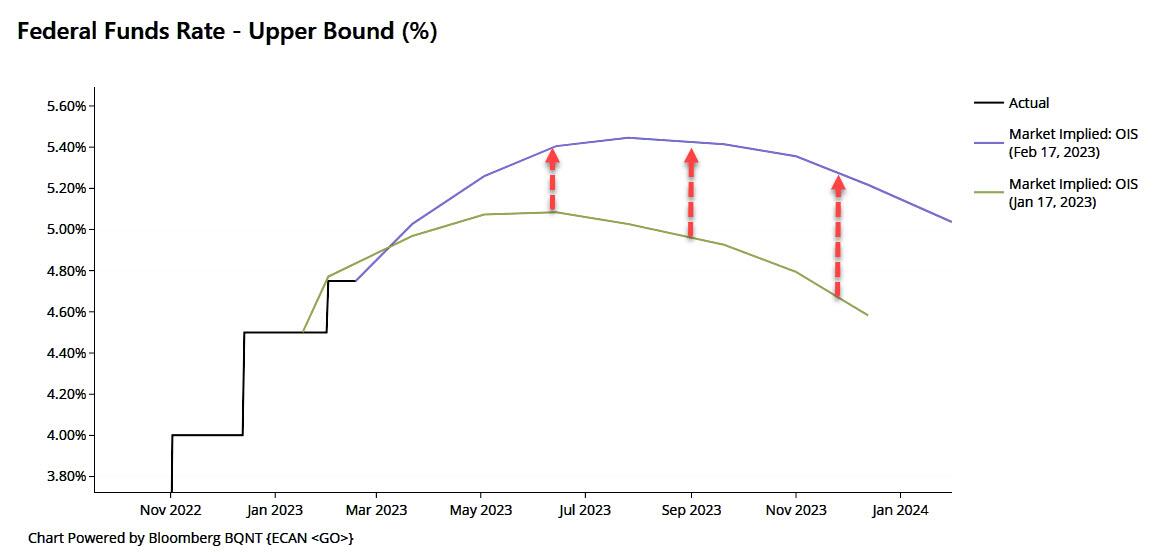
2. The formal house view: in light of the stronger growth and firmer inflation news, we are adding a 25 bps rate hike in June to our Fed forecast … for a peak funds rate of 5.25-5.50%.
3. NDX: it’s been noted that that January saw the best start to a year for NDX since … 2001. Apropos of nothing — this is simply some market trivia for the aficionados, it’s not my expectation of where we’re headed, but those were my formative years, so I can’t resist — note the following monthly returns back in that era: Oct ’00 -8% … Nov ’00 -24% … Dec ’00 -7% … Jan +11% … Feb -26% … Mar -18% … Apr +18%. For a bit more on this ever-interesting index, see chart 10 below.
4. Japan: Speaking of markets I have a soft spot for, say what of Ueda? To my eye, he appears more balanced and less ideological than what came before. For the official take from someone who would know: “we envisage a possibility that Prof Ueda may initially focus on a gradual retreat from YCC, paying due attention not to cause a large shock to the economy, before resetting to a more traditional policy framework based around controlling the short-term policy rate … our baseline scenario remains that the BOJ’s next step is to shorten the target duration of YCC to 5 years from the current 10 years in Q2” (link).
5. Europe: the equity market is off to its best start to a year since 1975 … SX5E has avoided back-to-back down days so far in 2023 … and the CAC index made an all-time high on Thursday. I confess I don’t really know what to do with all of this — put me in the camp of don’t-chase-it, but don’t-fight-it.
6. The podcast: this week features Allison Nathan from GIR. Topics include where the market could be wrong, $100 crude oil, the US debt cap and desert island.
7. The hedge fund industry, bullish: an updated, benchmark piece on the state of affairs in hedge fund land: link. I know I’m partisan, but if there’s one thing I’d flag here, it’s the improving prospects for HF returns in a higher rate environment: our historical analysis shows that when risk-free rates are 4%, returns rise to 16.5%.
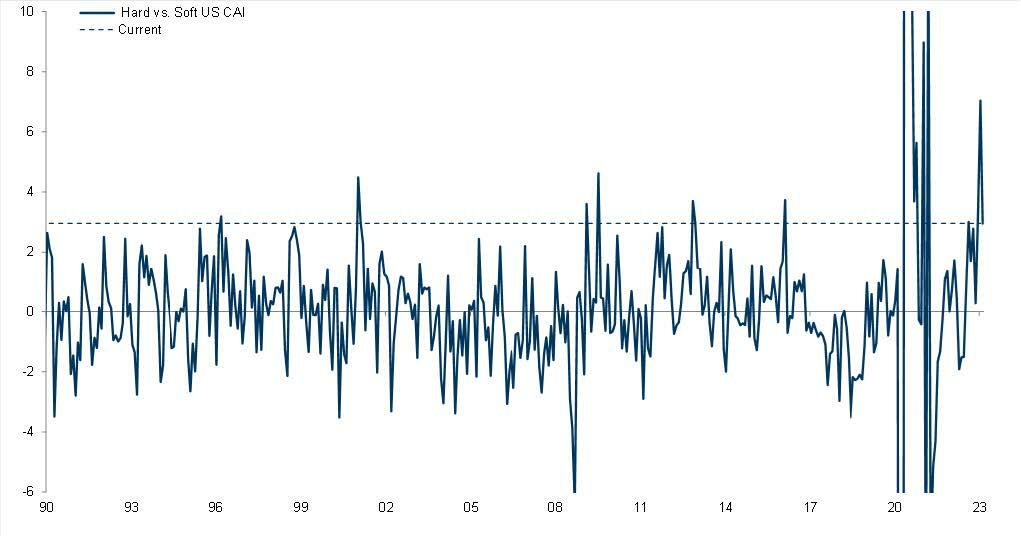
8. In a way, the post-COVID normalization of the US economy feels like a well-worn story at this point. when I look at this chart, however, it’s hard for me to think we’re beyond all of the oddities and contaminants and dichotomies. this is the gap between the hard and soft measures of the US economy (link):
9. Profit margins have peaked … I repeat, margins have peaked … and they are expected to revert back to pre-pandemic levels (link):
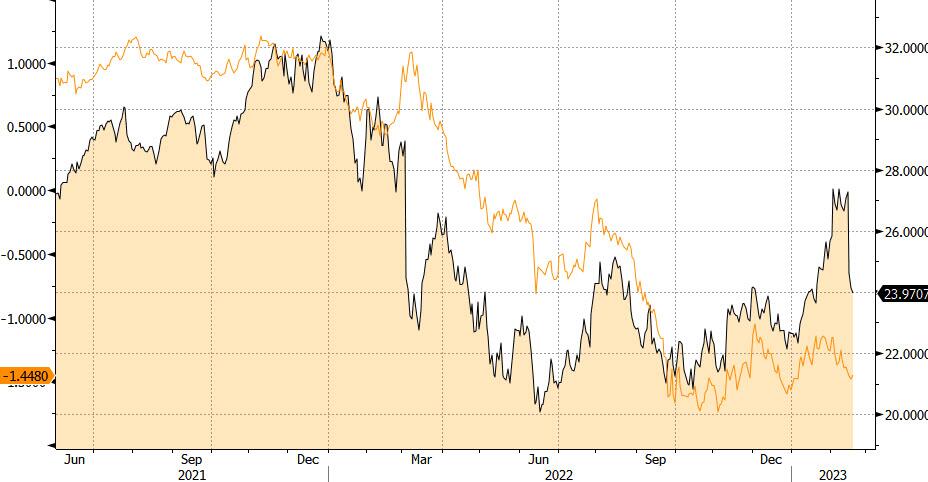
10. NDX is trading on a 24 forward P/E (on ’23 EPS), which is bang in line with the average level of the past seven years. that doesn’t necessarily inspire me … nor does the recent dislocation from US real rates (blue line, inverted for fit):
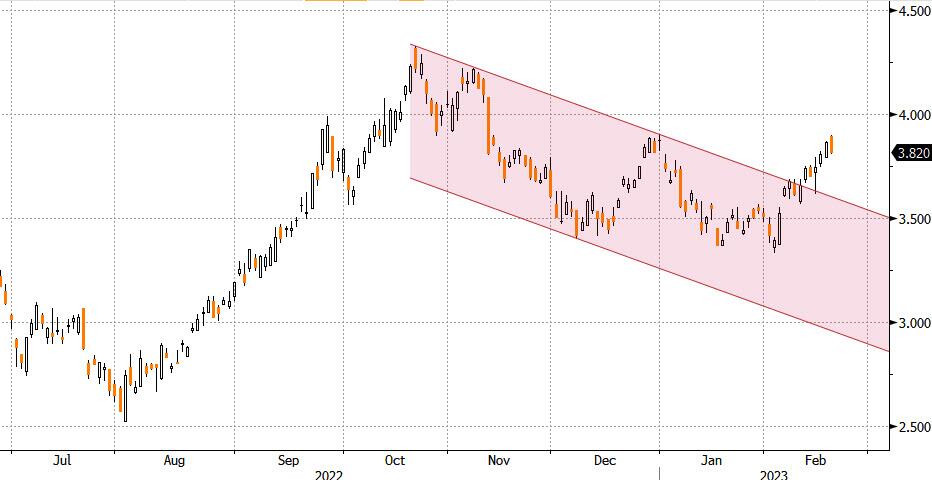
11. Jumping off that last point, US 10-year note yields have broken above the down channel off the October highs:
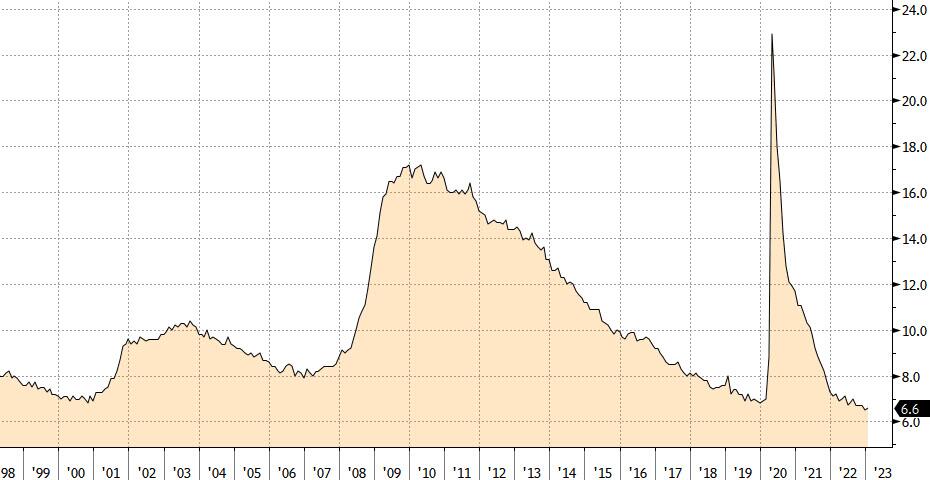
12. U-6, the broadest measure of US unemployment, over the past 25 years. this provokes a few responses: (1) don’t lose sight of the big picture, we haven’t seen a labor market tighter than this in a very long time; (2) note how long it took to recover the pre-GFC lows; (3) there’s a lot to like about re-shoring, while also wondering where the labor capacity will come from:
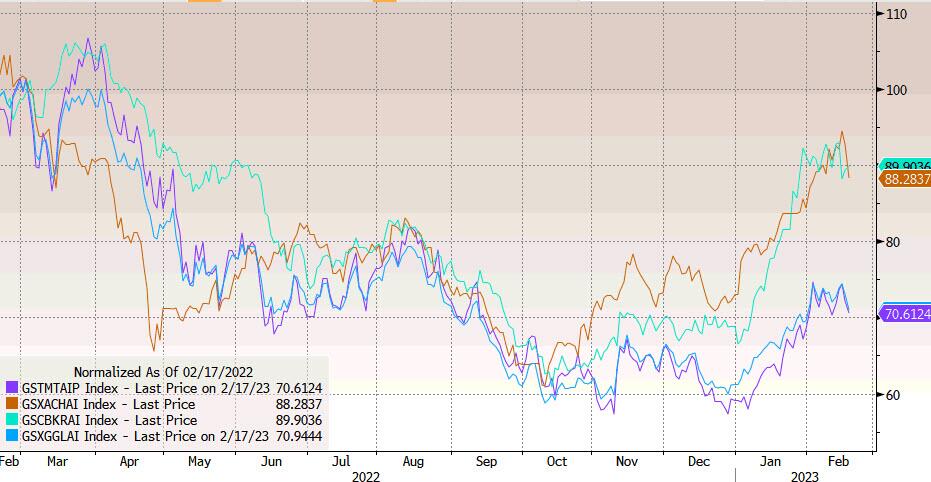
13. Finally, the AI theme has been a central one over recent weeks … I give credit to GBM colleague Lou Miller for some exceptional work on this story (link) … here’s how the global AI horse race is setting up … China (blue) and Korea (red) are a step ahead of the US (green) and the global basket (orange):
More in the full note available to pro subs.
Tyler Durden
Sat, 02/18/2023 – 19:00
Zero Hedge’s mission is to widen the scope of financial, economic and political information available to the professional investing public, to skeptically examine and, where necessary, attack the flaccid institution that financial journalism has become, to liberate oppressed knowledge, to provide analysis uninhibited by political constraint and to facilitate information’s unending quest for freedom. Visit https://www.zerohedge.com