
NVDA Adds Record Market Cap; Everything Else Dumps As Debt-Ceiling Idiocy Continues
Nvidia… that is all.
Yes there was macro data: GDP second look improved, jobless claims shitshow due to MS fraud revisions, pending home sales disappointed, Kansas City Fed better than expected; and some Fed Speak (Boston’s Collins sees a ‘pause’ – like everyone else), but really this was all about Jensen Huang (who’s personal; wealth jumped over $8 billion today).
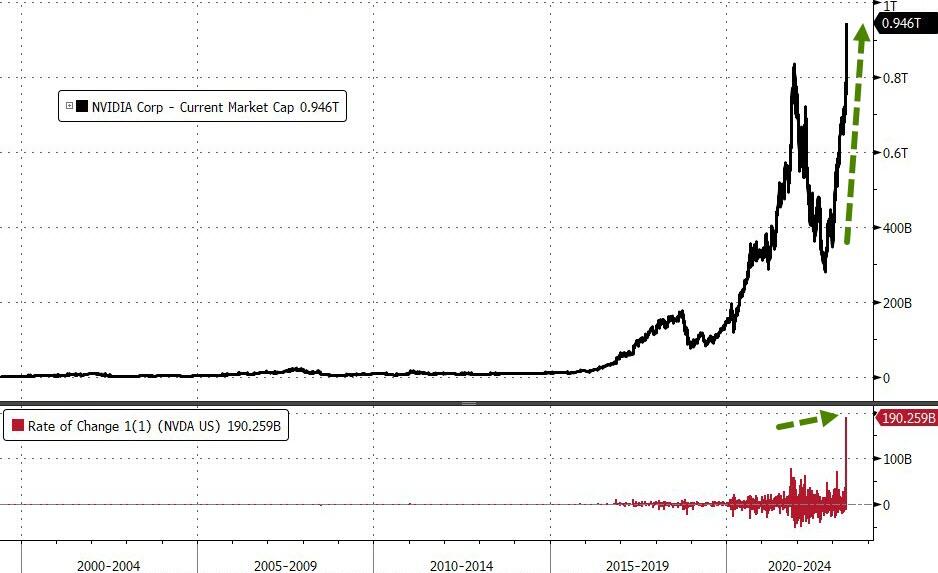
From the open, the day was all about one stock – NVDA, soaring 25% or so and adding just under $200 billion in market cap – that is 2 Intels! – and from the Oct 2022 lows, NVDA has added $665 billion in market cap…
Source: Bloomberg
That is the largest single-day market cap gain for any stock in US equity market history…

NVDA added more market cap today than the total market cap of 472 of 500 S&P companies, including:
-
Cisco (197.3BN)
-
Thermo Fisher ($197BN)
-
Accenture ($190BN)
-
AMD ($174BN)
-
T-Mobile ($168BN)
-
Adobe ($168BN)
-
Nike ($166BN)
-
Disney ($166BN)
-
Netflix ($162BN)
Bear in mind that it’s unclear how many jobs AI will have to replace to make the “$1 trillion data center” investment viable but Goldman has estimated 300 million middle/upper class jobs in US/Europe will be made obsolete… but at least your pension will be higher before you face permanent ejection from the workforce.
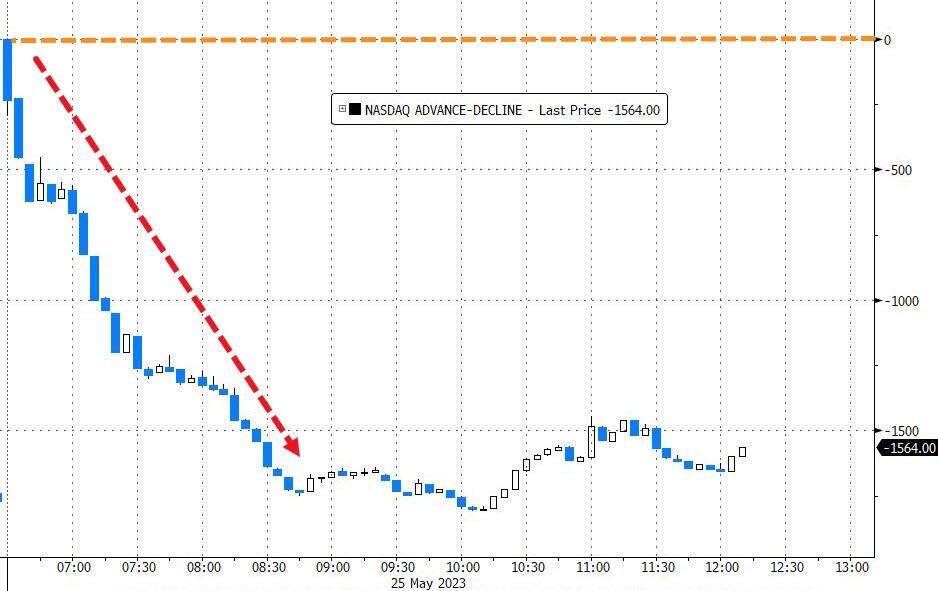
But, as the following Advance/Decline line for the Nasdaq shows, NVDA was practically alone…
Source: Bloomberg
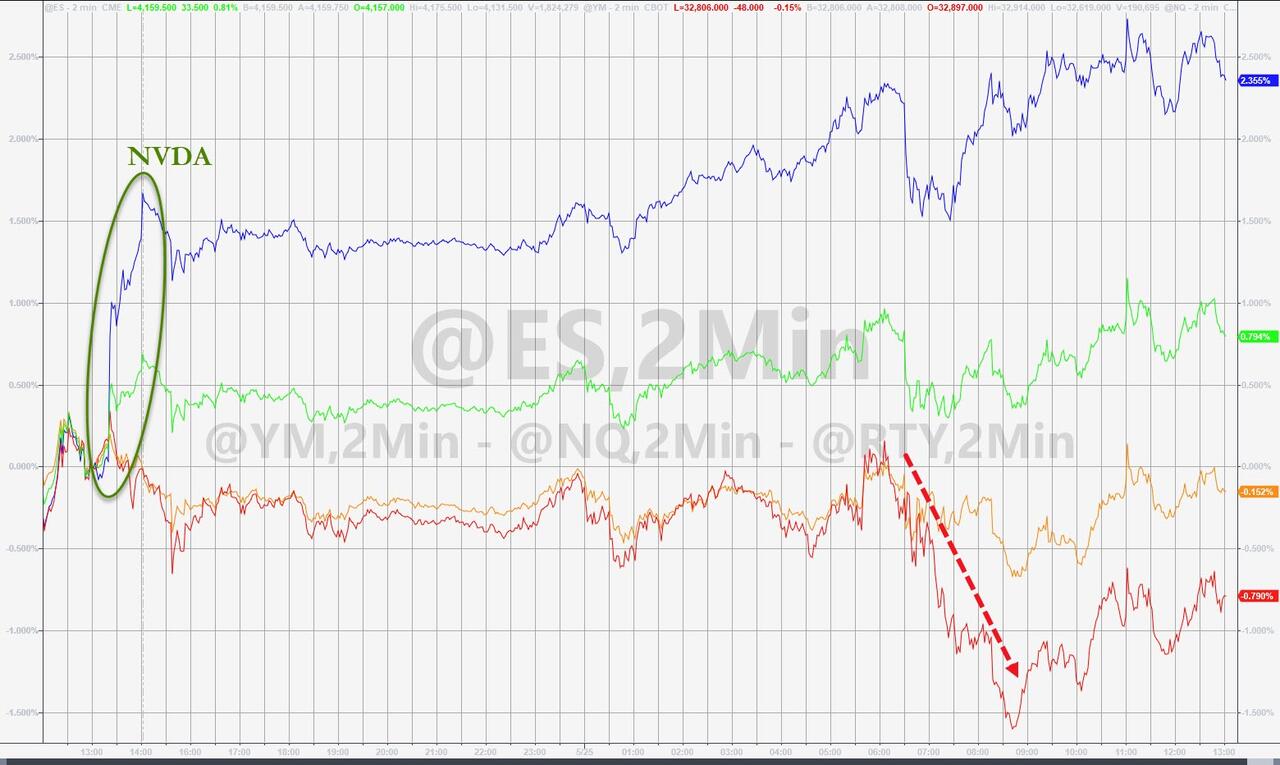
On the day, Nasdaq exploded higher (obviously), Small Caps lagged notably with The Dow unch and the S&P gaining helped by NVDA durr…
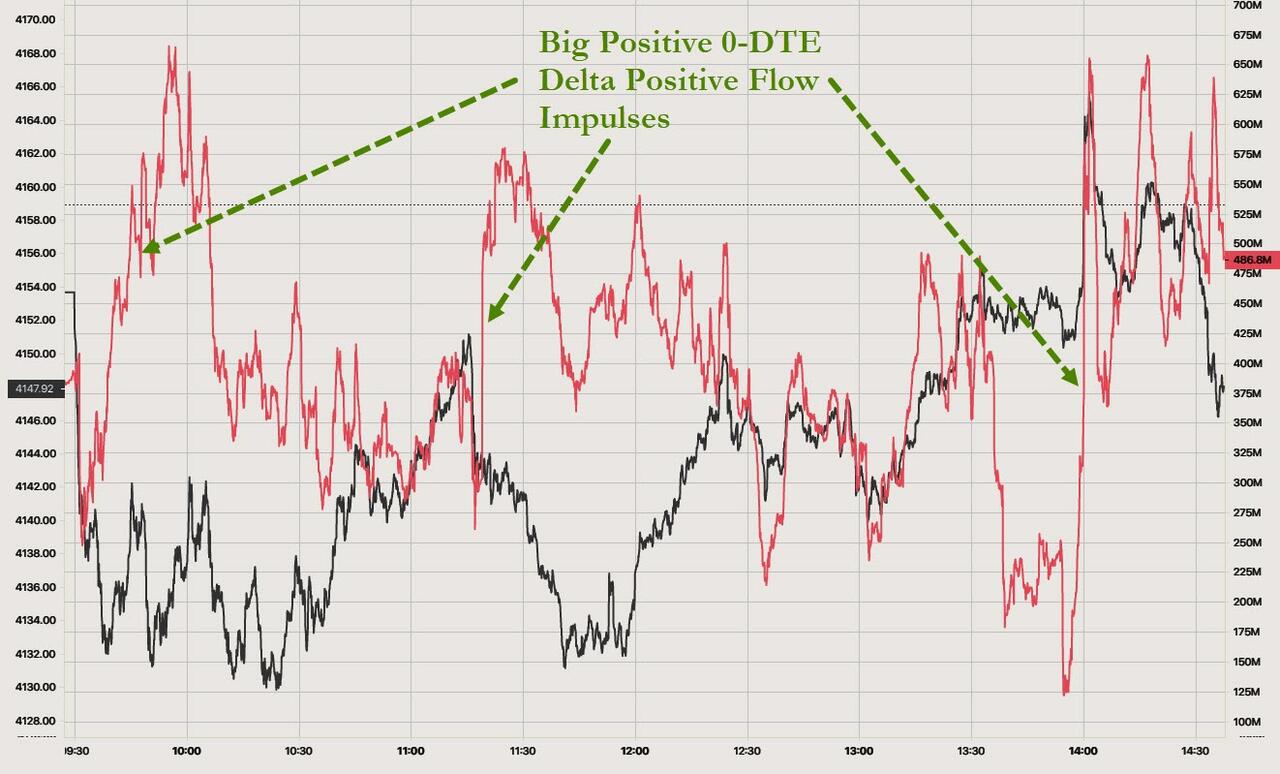
Notably 0-DTE traders were hell-bent on getting some upside traction going in the S&P with three big impulses during the day…
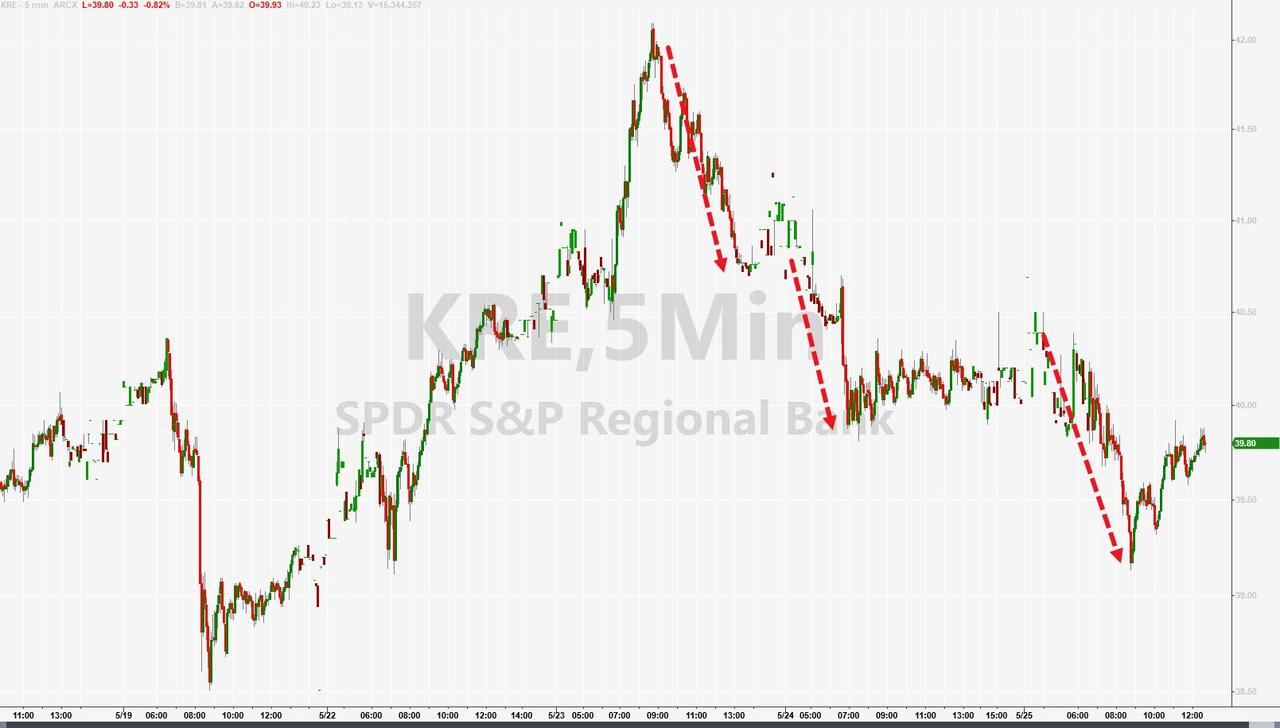
Small Caps suffered as banks were sold again ahead of tonight’s Fed bailout data…
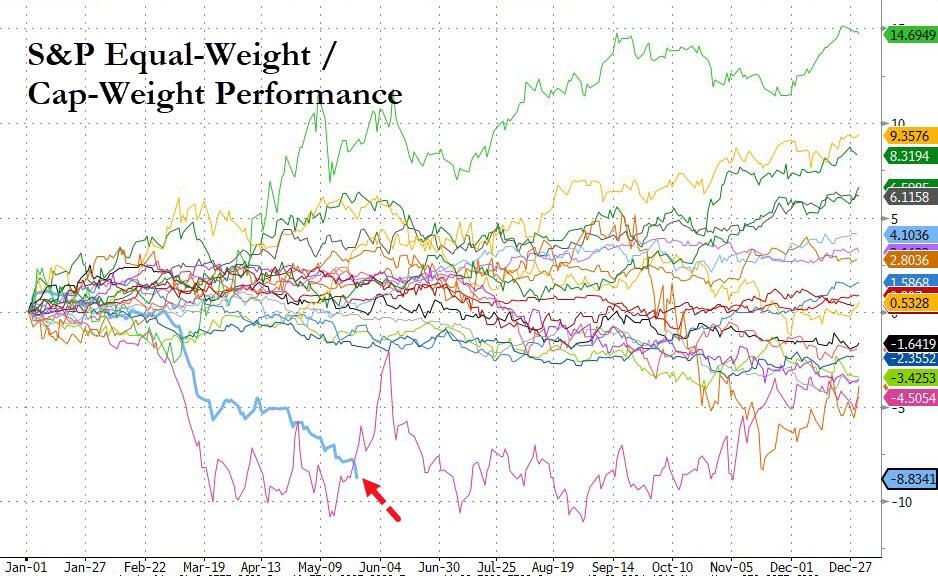
The equal-weight S&P 500 ended the day unch, while the cap-weight was up around 1%…

For some context with regard the concentration in markets, this is the seasonally worst relative performance of the equal-weight S&P to the cap-weight S&P in at least 30 years…
Source: Bloomberg
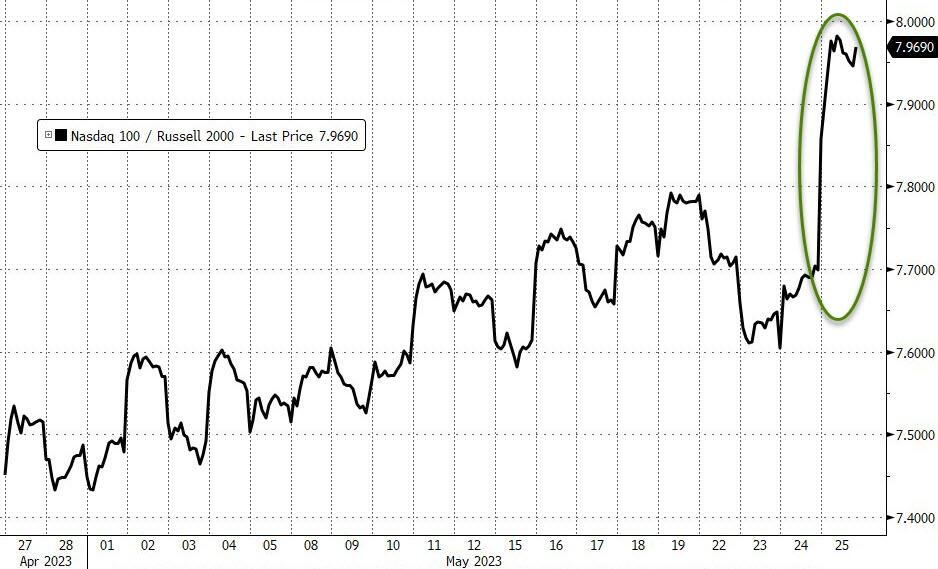
The divergence in performance today between Small Caps and Nasdaq was the largest since Nov 2020…
Source: Bloomberg
Treasuries were dumped hard today, because why make 4 or 5% risk-free when you can pile into a tech stock at 175x Trailing P/E? The short-end was clubbed like a baby seal relative to the long-end today (2Y +15bps, 30Y +1.5bps) and the 2Y is ugly on the week…

Source: Bloomberg
The 2Y Yield rose back above 4.50%, back ast its highest since the middle of the SVB bank collapse crisis…

Source: Bloomberg
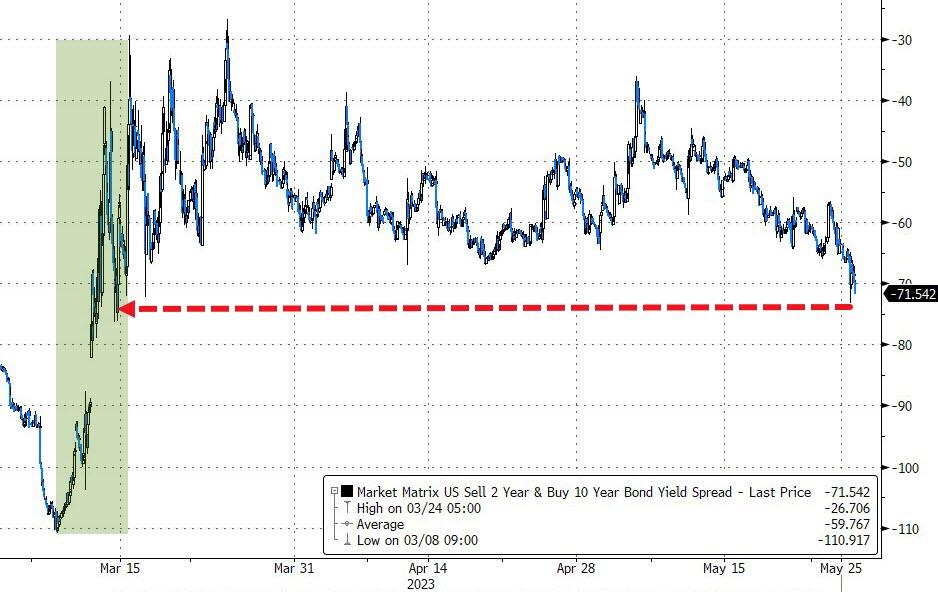
The yield curve (2s10s) flattened significantly, to its most inverted since the SVB crisis lows…
Source: Bloomberg
As Nomura’s Charlie McElligott noted earlier, the cross-market is real-time pricing-in debt deal optimism (@Punchbowl reporting “Rs expect the compromise will come together sometime in the next few days”) at the same time that the regional banks deposit-flight story remains (temporarily) quiet – which means that the “left tail” of the distribution being that “~150bps – 250bps emergency cut” type of calamity scenario is seeing its market implied probability crater… all while “higher for longer” (even holding terminal through end of year) picks up Delta, with the debt-deal compromise being expected in the next few days, allowing the Fed to get back to the economic task at hand.
The market can then too price-in the now very-well socialized concerns with regard to the back half of year “liquidity drain” which is set to accelerate powerfully both in US and Europe, as outlined recently where again, the danger feeds into “higher interest rates” but this time, largely from the risk of
1) TGA rebuild / T-Bill “supply shock” / “reserve drain” which can then bleed-into a “crowding-out” across the risk-curve…
…especially when occurring in conjunction with
2) aforementioned “higher for longer” Fed,
3) QT,
4) ongoing Deposit flight into MMF / RRP as additional siphoning of Reserves,
5) consumer and corporate drawdown on remaining pandemic “excess savings,”
6) expiration of student loan moratorium, and
7) a monster European TLTRO repayment in Jun and 8) APP reinvestment cessation in July
And that is all very evident in the dramatically hawkish trend in STIRs…

Source: Bloomberg
The dollar rallied for the 9th day of the last 11 to its highest since 3/17/23 as flight cash continues…

Source: Bloomberg
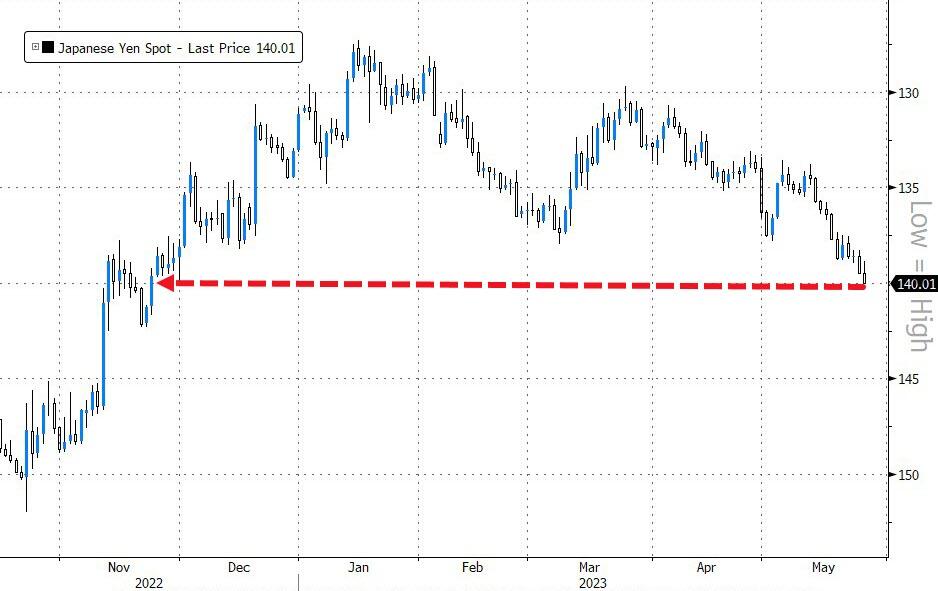
Japanese Yen fell to 140/USD for the first time since 11/23/22…
Source: Bloomberg
Gold was puked back to two-month lows…

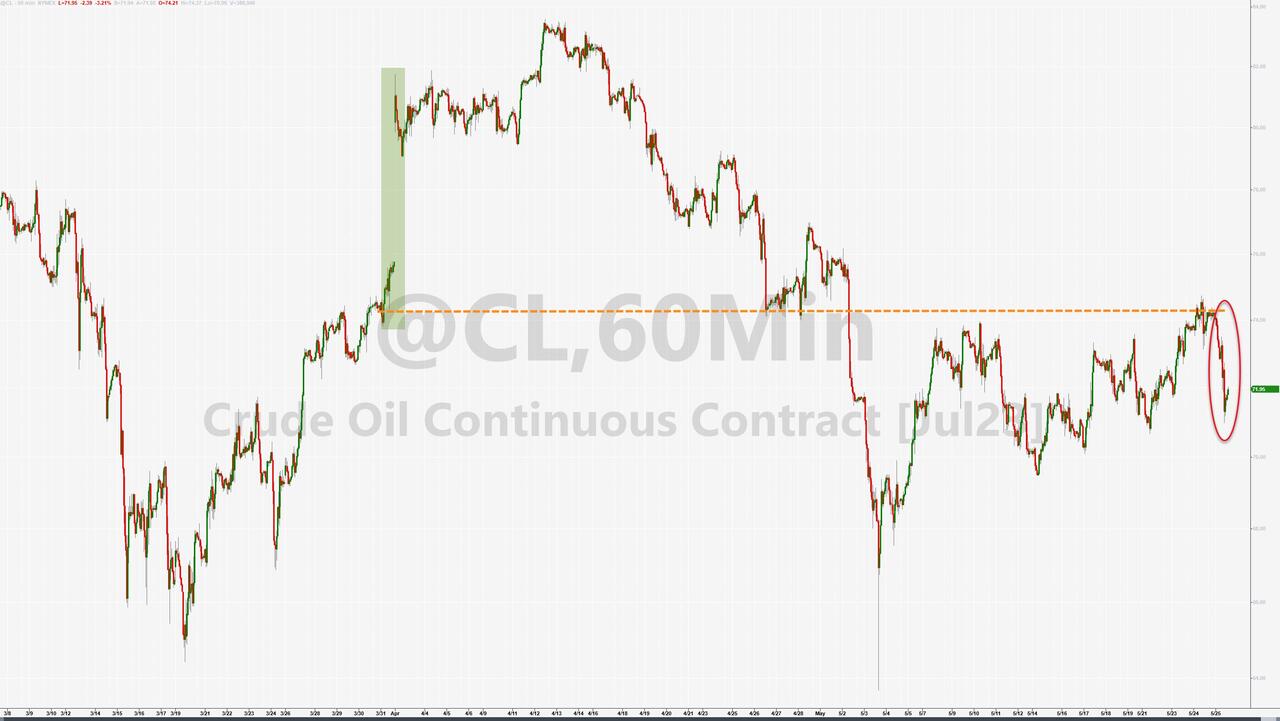
Oil tumbled after Russia poured cold water on OPEC+ production cut “ouchy” threat…
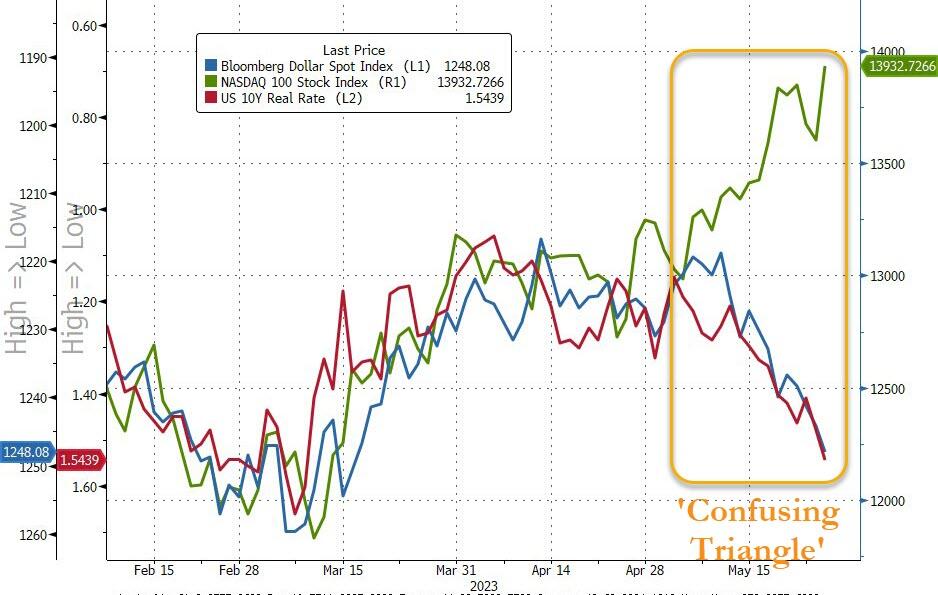
The “confusing triangle” continues its trilemma-y ways…
Source: Bloomberg
Finally, we note that the last time Nasdaq was this high relative to small caps was the peak of the dotcom bubble…
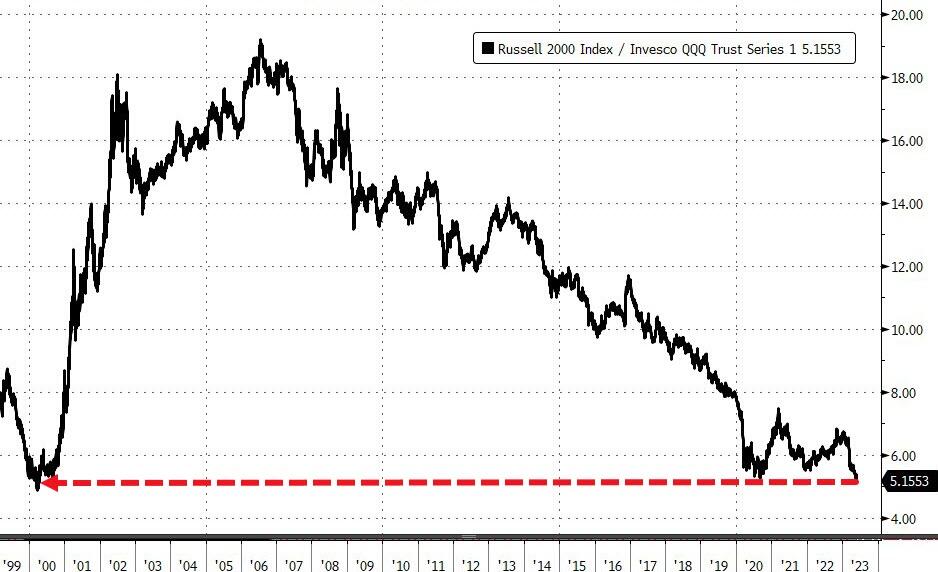
Source: Bloomberg
..probably nothing, right?
Tyler Durden
Thu, 05/25/2023 – 16:00
Zero Hedge’s mission is to widen the scope of financial, economic and political information available to the professional investing public, to skeptically examine and, where necessary, attack the flaccid institution that financial journalism has become, to liberate oppressed knowledge, to provide analysis uninhibited by political constraint and to facilitate information’s unending quest for freedom. Visit https://www.zerohedge.com